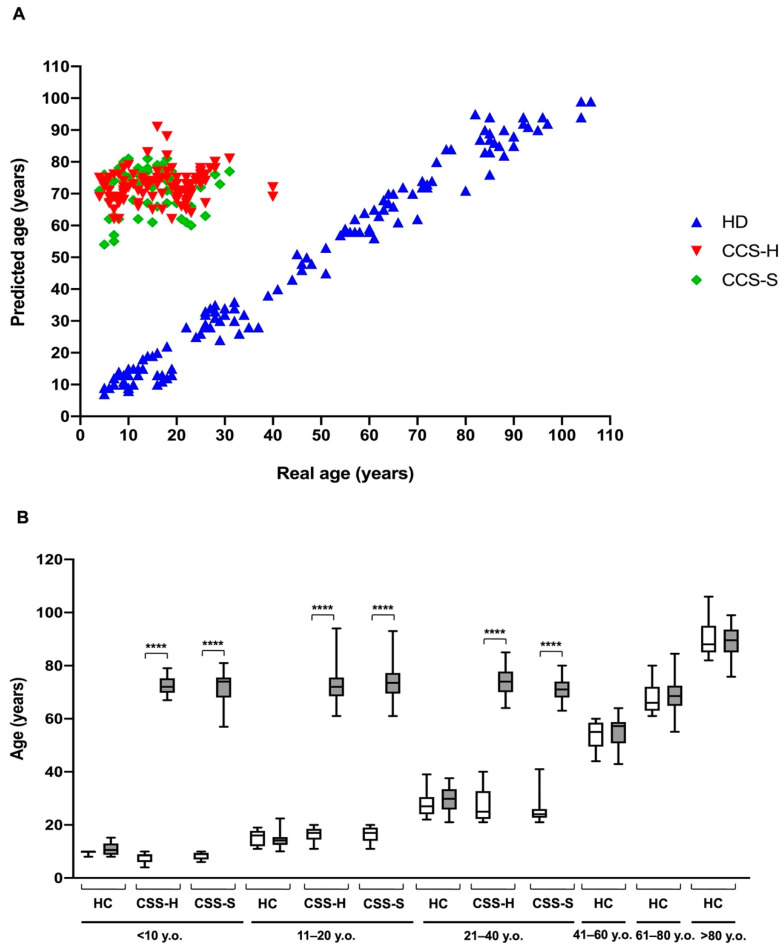
Figure 5.
Comparison of real and predicted ages in MNCs isolated from CCS and age-matched and elderly healthy controls. The predicted age was obtained by applying a mathematical model developed by a machine learning method and based on several parameters of glucose metabolism [28]. The data were obtained by evaluating the biochemical parameters of MNCs isolated from: age-matched healthy controls (<10 y.o. n = 17; 11–20 y.o. n = 18; 21–40 y.o. n = 24), CCS of hematological tumors (<10 y.o. n = 26; 11–20 y.o. n = 33; 21–40 y.o. n = 30), CCS of solid tumors (<10 y.o. n = 22; 11–20 y.o. n = 29; 21–40 y.o. n = 10), adult healthy controls (n = 21; 41–60 y.o.), and elderly healthy controls (61–80 y.o. n = 22 and > 80 y.o. n = 25). (A) shows the distribution of healthy control (HC, blue), CCS of hematological tumors (CCS-H, red), and CCS of solid tumors (CCS-S, green) in relation to real and predicted age. (B) reports the comparison between the real and predicted ages within the same population, subdivided on the basis of decades. Statistical analysis was performed via non-parametric statistical approach (Mann–Whitney U test). **** indicates a p-value of p < 0.0001 between real and predicted age.

