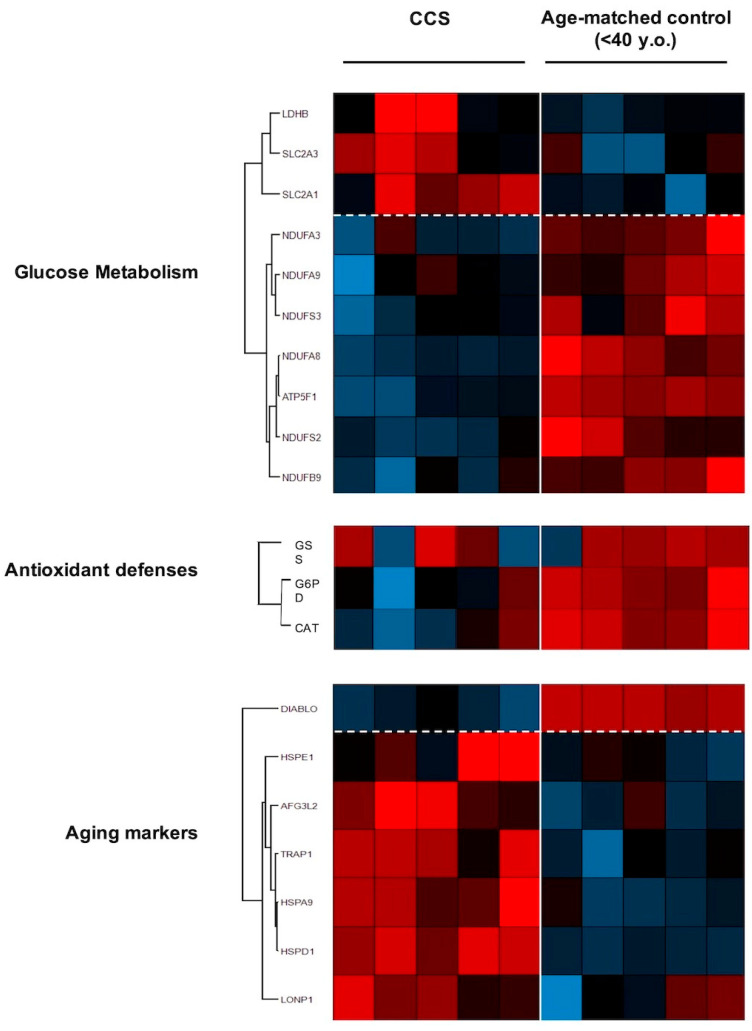
Figure 6.
Proteomic analysis of MNCs isolated from CCS and age-matched healthy controls. The figure shows a representative expression heat map of proteins involved in glucose metabolism, antioxidant proteins, and aging markers. Data are expressed as ratios over mean values for the two conditions (red = expression above mean, black = expression at mean; blue = expression below mean). Each datum represents five independent experiments.

