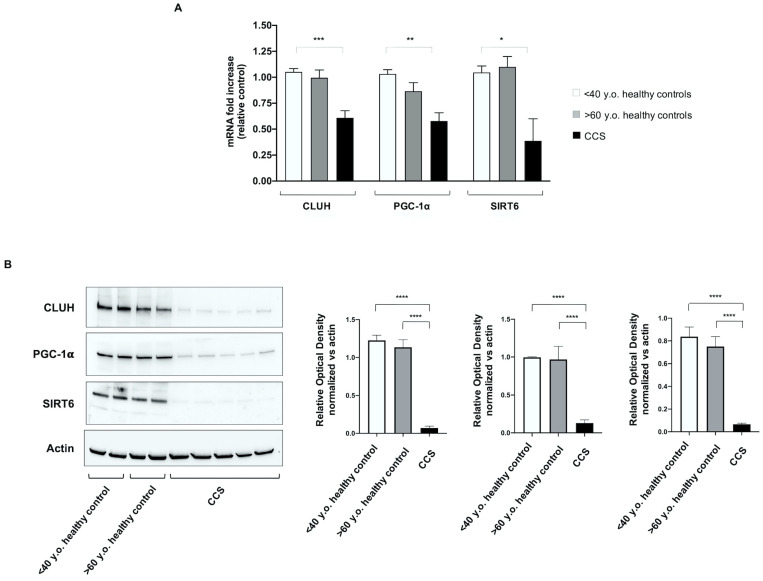
Figure 7.
Evaluation of gene and protein expression of CLUH, PGC1-α, and SIRT6 in MNCs isolated from CCS and age-matched and elderly healthy controls. In (A) the graph reports the genomic expression of CLUH, PGC1-α, and SIRT6 in MNCs isolated from age-matched healthy controls (<40 y.o. n = 10), CCS (<40 y.o. n = 16), and elderly healthy controls (>60 y.o. n = 12). (B) reports the WB signals against CLUH, PGC1-α, and SIRT6 (left) and the relative densitometric analyses (right) of MNCs isolated from age-matched healthy controls (<40 y.o.), elderly healthy controls (>60 y.o.), and CCS (<40 y.o.). Data are representative of four independent experiments each and are expressed as mean ± SD. The values of WB signals were normalized against an actin signal. Statistical analysis was performed via non-parametric statistical approach (Mann–Whitney U test). *, **, *** and **** indicate p-values of p < 0.05, 0.01, 0.001, and 0.0001, respectively, between CCS samples and age-matched healthy controls. No significant differences were observed between age-matched and elderly healthy controls. Original blots see Supplementary Figure S3.

