Figure 2.
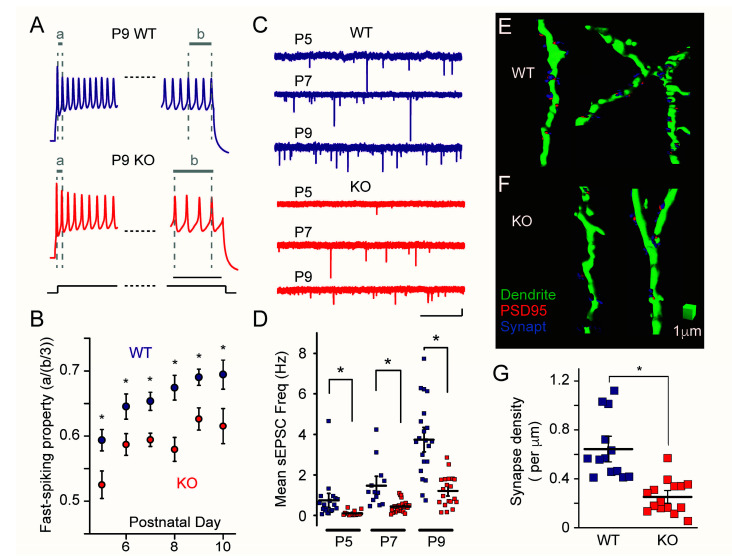
(A) Representative voltage response traces of PV interneurons in developing (postnatal day 9: P9) Fmr1 WT (top) and KO (bottom) mice. The initial and final portions of the 500-ms-long traces were magnified for clarity. Note the significantly greater ratio of the last three inter-spike intervals “b” to the first inter-spike interval “a” in KO mice compared to in WT mice, which indicates that PV interneurons equip less fast-spiking properties in KO mice. Calibration: 50 ms. (B) Collective data for fast-spiking property during the development (P5–P10) in Fmr1 WT and KO mice. The spiking property was quantified by “a” divided by “b/3”. * Denotes p < 0.05. (C) Representative sEPSC traces recorded from developing (P5–P9) PV interneurons in Fmr1 WT (top) and KO (bottom) mice. Calibration: 1 s and 10 pA. (D) Collective data for sEPSC frequency. Each data point represents the mean sEPSC frequency in each cell. The frequency increases developmentally but remains lower in Fmr1 KO mice. (E,F). Three-dimensional renderings of dendritic segments (green) of PV interneurons in Fmr1 WT (E) and KO (F) mice. Synapses are labeled with the colocalized puncta of postsynaptic marker PSD95 (red) and presynaptic marker synaptophysin (“Synapt”: blue). The reference cube represents 1-μm calibrations. (G) Collective data for the analysis of the synapse densities in Fmr1 WT and KO mice (P9–P10). The density of the synapses was significantly lower in Fmr1 KO mice (from Reference [81] with edits).

