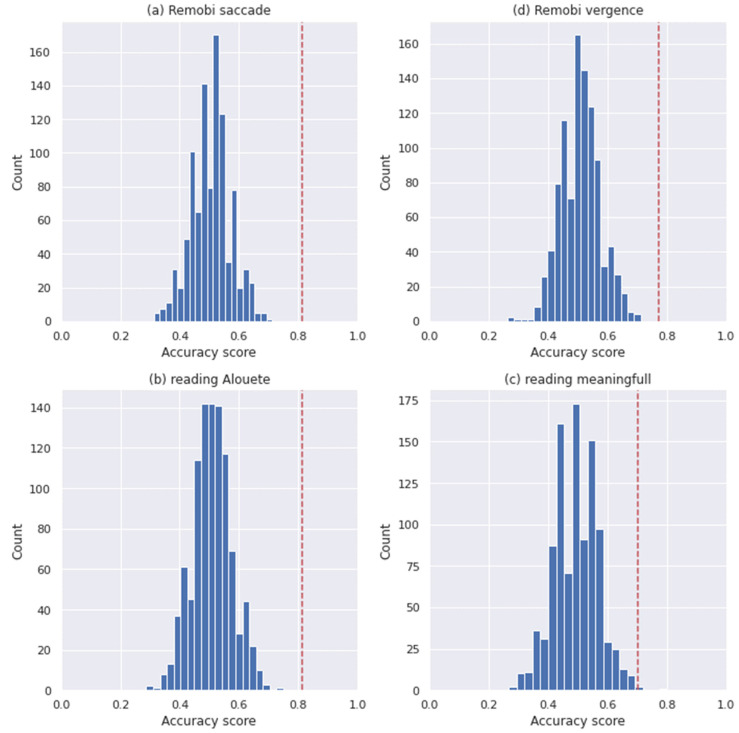
Figure 2.
Logistic regression test permutation histograms for Analysis 1, the red line indicated the reported score. (a) the histogram of the Remobi saccade dataset. (b) the histogram of the Remobi vergence dataset. (c) the histogram of the reading Alouette, (d) the histogram of the reading meaningful.

