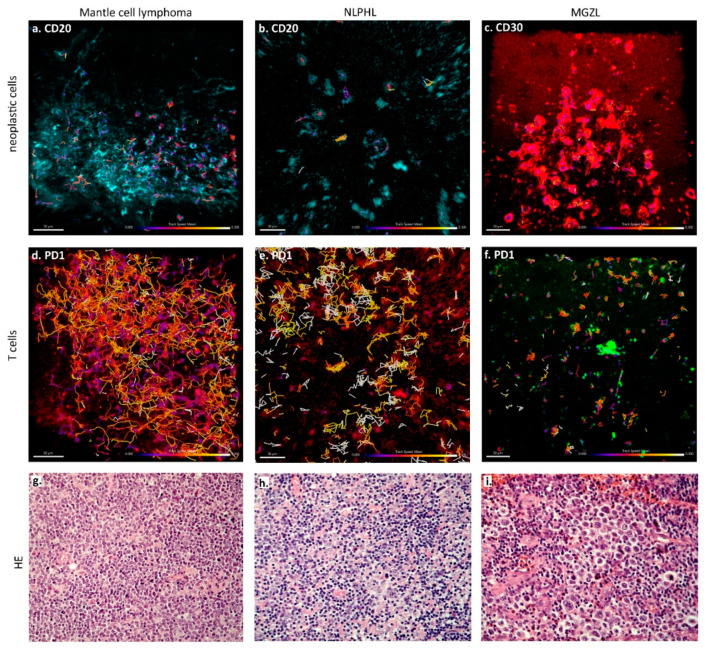
Figure 2.
Cell tracks according to different lymphoma types superimposed on fluorescence images. (a–c) Tracks of the tumor cells of mantle cell lymphoma (a), NLPHL (b) and MGZL (c) in CD20- or CD30-immunostaining, as indicated. Color of tracks corresponds to the observed velocity as indicated in the scale. (d–f) Tracks of the bystander T cells of the same cases: mantle cell lymphoma (d), NLPHL (e) and MGZL (f) in PD1-staining. Color of tracks corresponds to the observed velocity as indicated in the scale. (g) HE staining (200x) of the mantle cell lymphoma from (a,d). (h) HE staining (200x) of the NLPHL from (b,e). (i) HE staining (200×) of the MGZL from (c,f).

