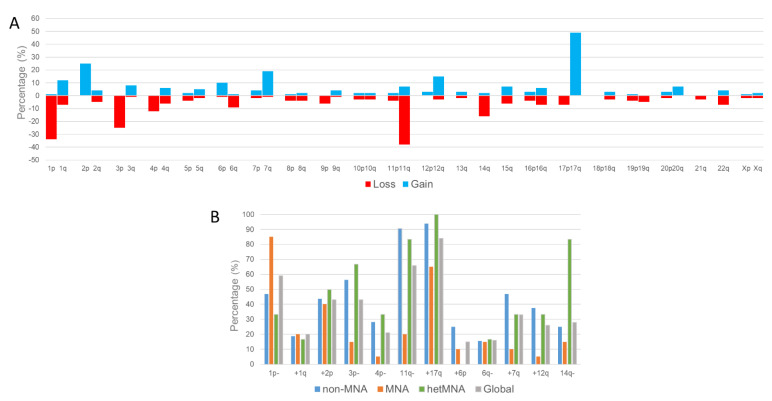
Figure 4.
Percentage of the analysed cases that showed (A) segmental chromosomal aberrations in each chromosome arm (losses of genomic material are in red, and gains in blue). (B) Percentage of each segmental chromosome aberration observed in the cases MYCN non-amplified (non-MNA, blue), MYCN amplified (MNA, orange) or with heterogeneous amplification of MYCN (hetMNA, green), and in all the analyzed high-risk neuroblastoma cases (grey).

