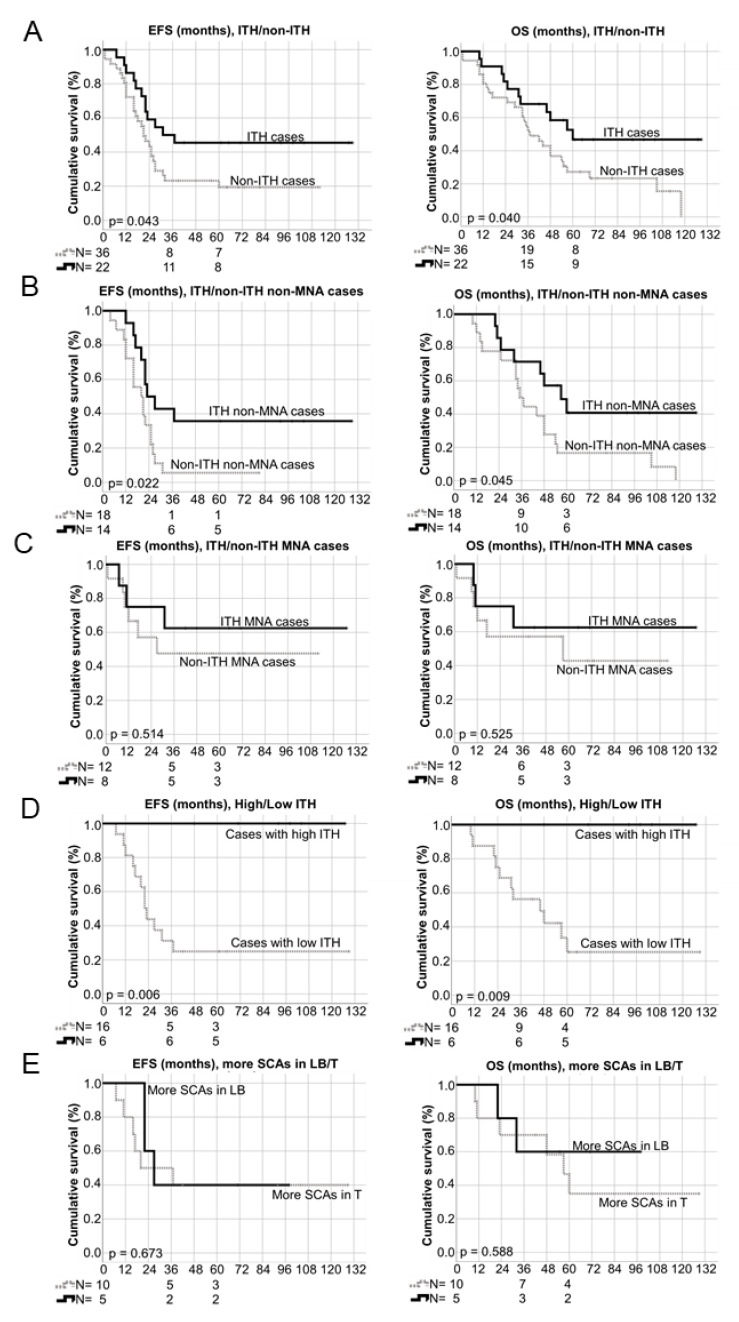
Figure 5.
Kaplan–Meier graphs showing event free and overall survivals (left side, EFS and right side, OS) depending on different variables: (A) intra-tumour heterogeneity (ITH) detected or not detected (non-ITH) in all the studied cases; (B) ITH detected or not detected (non-ITH) in MYCN non-amplified (non-MNA) cases; (C) ITH detected or not detected (non-ITH) in MYCN amplified (MNA) cases; (D) high ITH (tumors with 50% or more different genomic events between the analysed samples) versus low ITH (tumours with ITH but with less than 50% different genomic events between the analysed samples); (E) higher number of segmental chromosomal aberrations (SCAs) observed in liquid biopsy (LB) versus higher number in solid tumour (T) samples. N: number of cases. 3-year and 5-year number of survivors, as well as p-values are shown.

