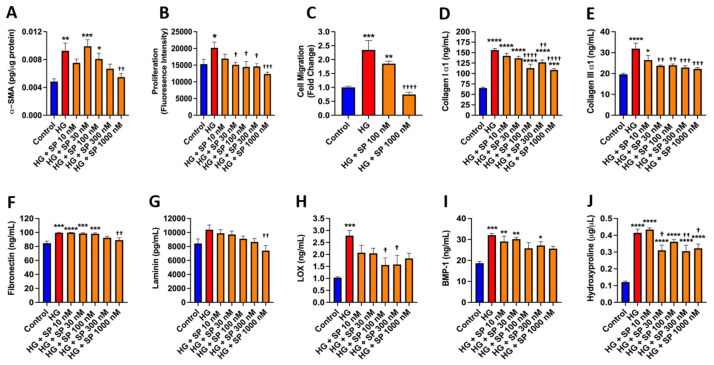
Figure 2.
SP opposes the effects of high glucose on cardiac fibroblast phenotype and function. Isolated mouse cardiac fibroblast (A) α-smooth muscle actin (α-SMA) in cell lysate; (B) cellular proliferation; (C) and cell migration in response to normal glucose (Control, 5 mM), high glucose (HG, 25 mM), and HG with increasing concentrations of SP (10 to 1000 nM). (D) collagen I α1; (E) collagen III α1; (F) fibronectin; (G) laminin; (H) lysyl oxidase (LOX); and (I) bone morphogenic protein-1 (BMP-1) measured in the cell culture media from isolated cardiac fibroblasts in response to control, HG, and HG with increasing concentrations of SP (10 to 1000 nM). (J) hydroxyproline measured in the media from cultured human cardiac fibroblasts in response to control, HG, and HG with increasing concentrations of SP (10 to 1000 nM). Data are expressed as mean ± SEM and were analyzed by one-way ANOVA with Tukey post hoc test; * p < 0.05 vs. control, ** p < 0.01 vs. control, *** p < 0.001 vs. control, **** p < 0.0001 vs. control, † p < 0.05 vs. HG, †† p < 0.01 vs. HG, ††† p < 0.001 vs. HG, †††† p < 0.0001 vs. HG. n = 4–6 for control and n = 5–6 for all other groups.

