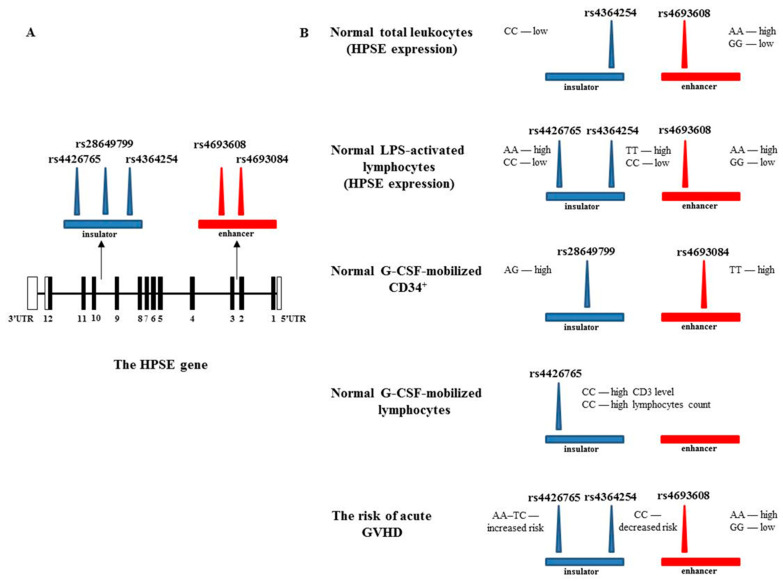
Figure 3.
Scheme describing the correlation between enhancer and insulator SNPs with heparanase expression, G-CSF mobilization, and the risk of acute GVHD after HSCT. (A). HPSE gene map. The numbered boxes represent 12 exons. Shaded rectangles signify an open reading frame, and open boxes indicate the 5′- and 3′-untranslated regions. Arrows mark the location of the enhancer (red rectangle) and insulator (blue rectangle). The three insulator SNPs and two enhancer SNPs analyzed are marked as blue and red triangles, respectively. (B). Impact of heparanase SNPs on various processes.

