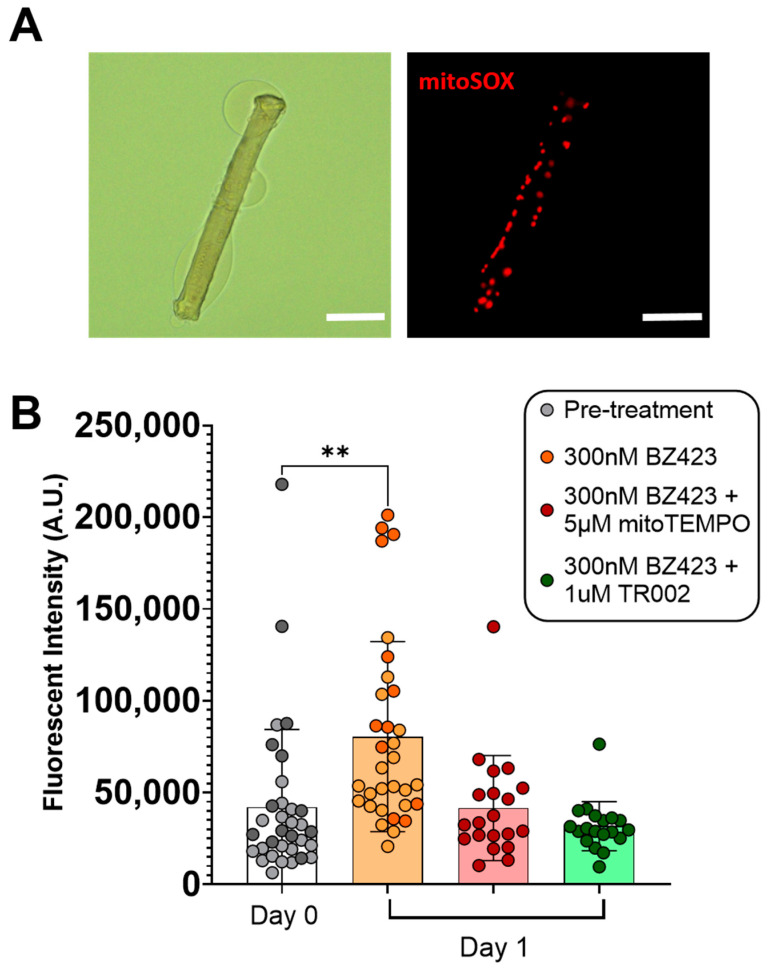
Figure 2.
To examine the impact of chemical induction of MPT on mROS emission, single isolated myofibers were treated with either 300 nM Bz423, 300 nM BZ423 + 5 µM mitoTEMPO (to scavenge ROS), or 300 nM BZ423 + 1 µM TR002 (to inhibit MPT) for 24 h, and mitoSOX signal was determined at baseline and post-treatment. (A) Representative brightfield and fluorescence images of single FDB muscle fibers following 24 h treatment with Bz423. Scale bars represent 100 µm. (B) Both mitoTEMPO and TR002 prevented an increase in mitoSOX fluorescence over the 24 h treatment period, while fluorescence increased following treatment with BZ423, indicating an increase in mROS emission. Biological replicates are identified by data points of different colors within a given treatment, while technical replicates share the same color data point. n = 2 biological replicates were used for pre-treatment and 300 nM Bz423-treated myofibers, while n = 1 biological replicate was used for all other groups. ** p < 0.01 versus Day 0.

