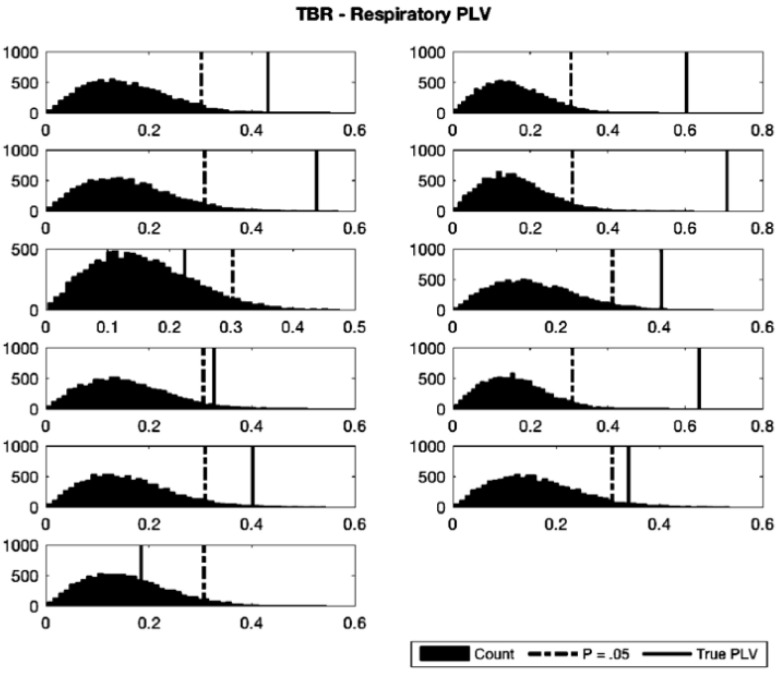
Figure 4.
Resampled distributions of TBR-respiratory PLVs for 11 participants. Resampling (n = 10,000) was carried out with replacement under the null hypothesis of no relationship between TBR and respiratory phase. Black dotted lines indicate critical values of significance (p = 0.05) and solid black lines indicate true participant PLV. Vertical axes show counts of resampled distributions, horizontal axes show computed p-values.

