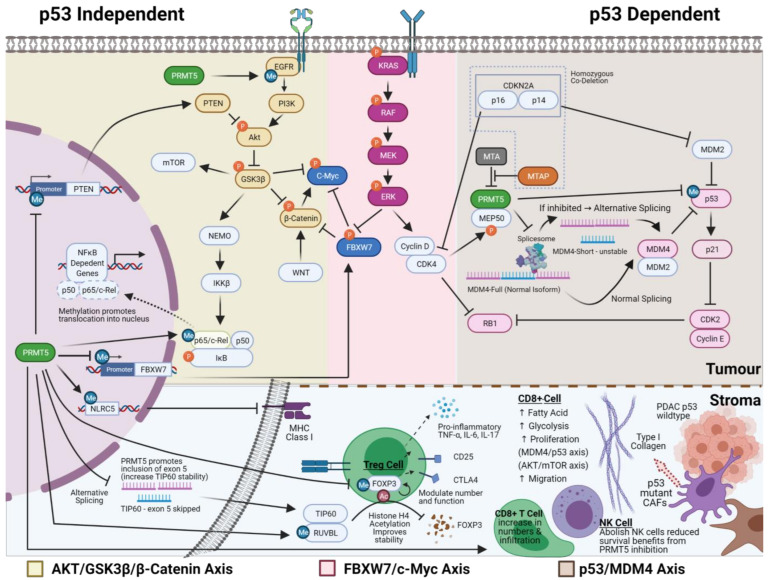
Figure 2.
The mechanism of action of PRMT5. The figure portrays three best characterised axes of how PRMT5 can drive cancer growth that may be of relevance in PDAC, namely AKT/GSK3-β/β-Catenin axis, FBXW7/c-Myc axis and p53/MDM4 axis. The complex interplay between methylation, phosphorylation, acetylation and ubiquitination are denoted by blue (Me), orange (P) and brown (Ac) colours, respectively. The bottom panel highlights some of the possible effects that PRMT5 inhibition may have on the tumour microenvironment and how this relates to what we know about PDAC stroma and its interplay with PDAC tumour cells. Created with BioRender.com.

