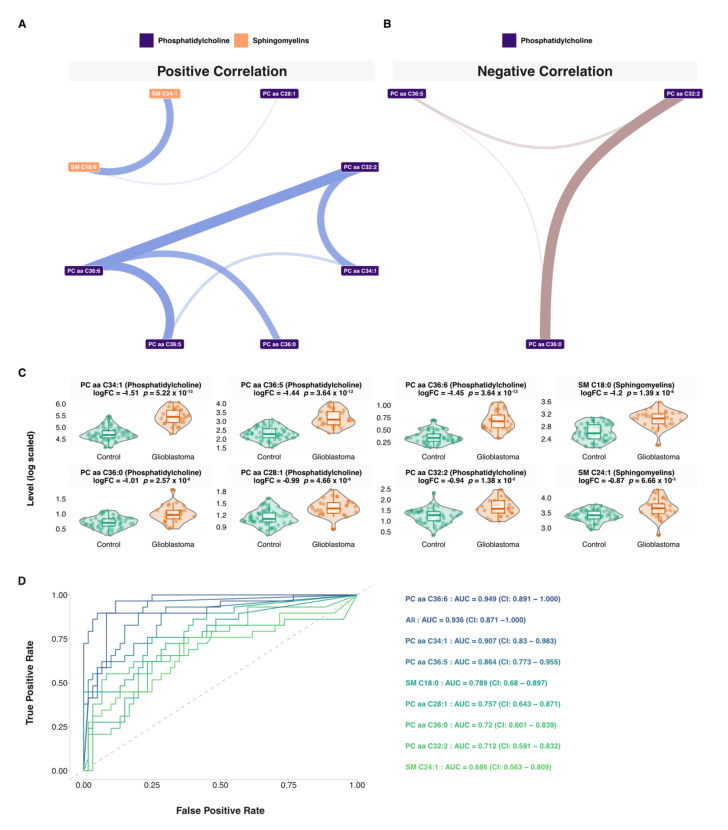
Figure 7.
Network and machine learning analysis. (A) Negative correlation network visualization of the glioblastoma consensus metabolic signature. (B) Positive correlation network visualization of the glioblastoma consensus metabolic signature. Line width is proportional to the Spearman correlation. (C) Boxplots of the consensus plasma metabolic signature. (D) ROC curves of the Random Forest predictive models, including seven phosphatidylcholines (PC aa C36:6, PC aa C32:2, PC aa C36:0, PC aa C36:5, PC aa C34:1, and PC aa C28:1) and two sphingomyelins (SM C18:0 and SM C24:1). AUC and 95% confidence intervals (CI) were calculated using balanced subsampling with 50 repeats.

