
FIG 6.
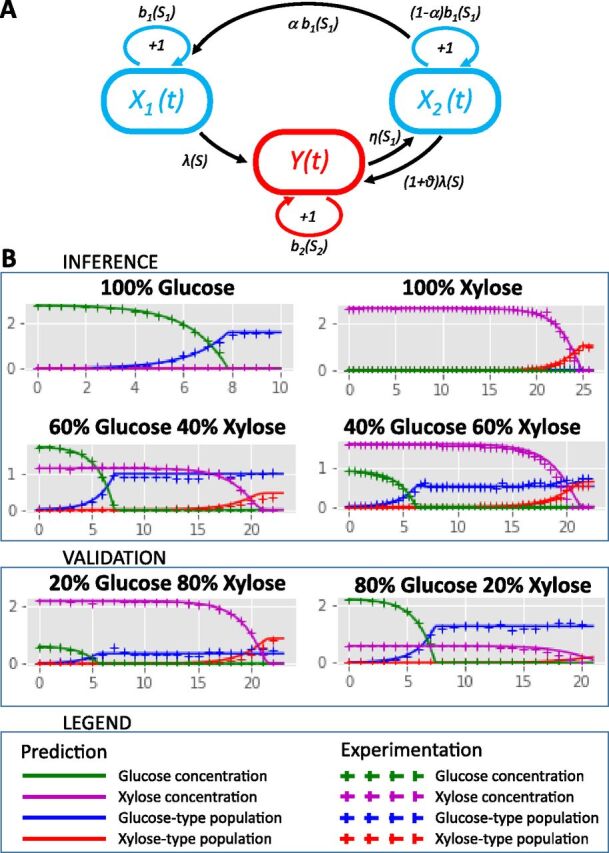
Modeling subpopulation behavior. (A) Scheme of the stochastic model. The diagram shows individual growth and transitions between cell types in the population. X1 corresponds to glucose consumers with the basal level of XylR, Y to xylose consumers with a high level of XylR, and X2 to glucose consumers that previously grew on xylose with an initially high but decreasing level of XylR. We assume that these mechanisms occur after a random time distributed according to an exponential law with the corresponding rates. Indeed, an individual that grows on glucose (class X1 or X2) divides at rate b1(S1) or switches to xylose consumption at rate λ(S) and (1+θ)λ(S), respectively. Specifically, in the X2 compartment, where cells have many xylR copies, each individual can give birth to a cell of the compartment X1 with probability 0 < α < 1 because of xylR dilution. In addition, an individual growing on xylose (class Y) divides at rate b2(S2) or switches to glucose consumption (class X2) at rate η(S1), if glucose is abundant. (B) Validation and predictions of the model (solid lines) compared to the experimental data (crosses) during growth on six glucose-xylose mixes (glucose cell type in blue, xylose cell type in red, glucose in green, and xylose in violet). The conditions 80% glucose−20% xylose and 20% glucose−80% xylose were not used to estimate the model parameters. The lines represent predictions, whereas in the other conditions, they represent validation.