
Figure 1. Paralog dependencies are missed in single-gene CRISPR KO screens.
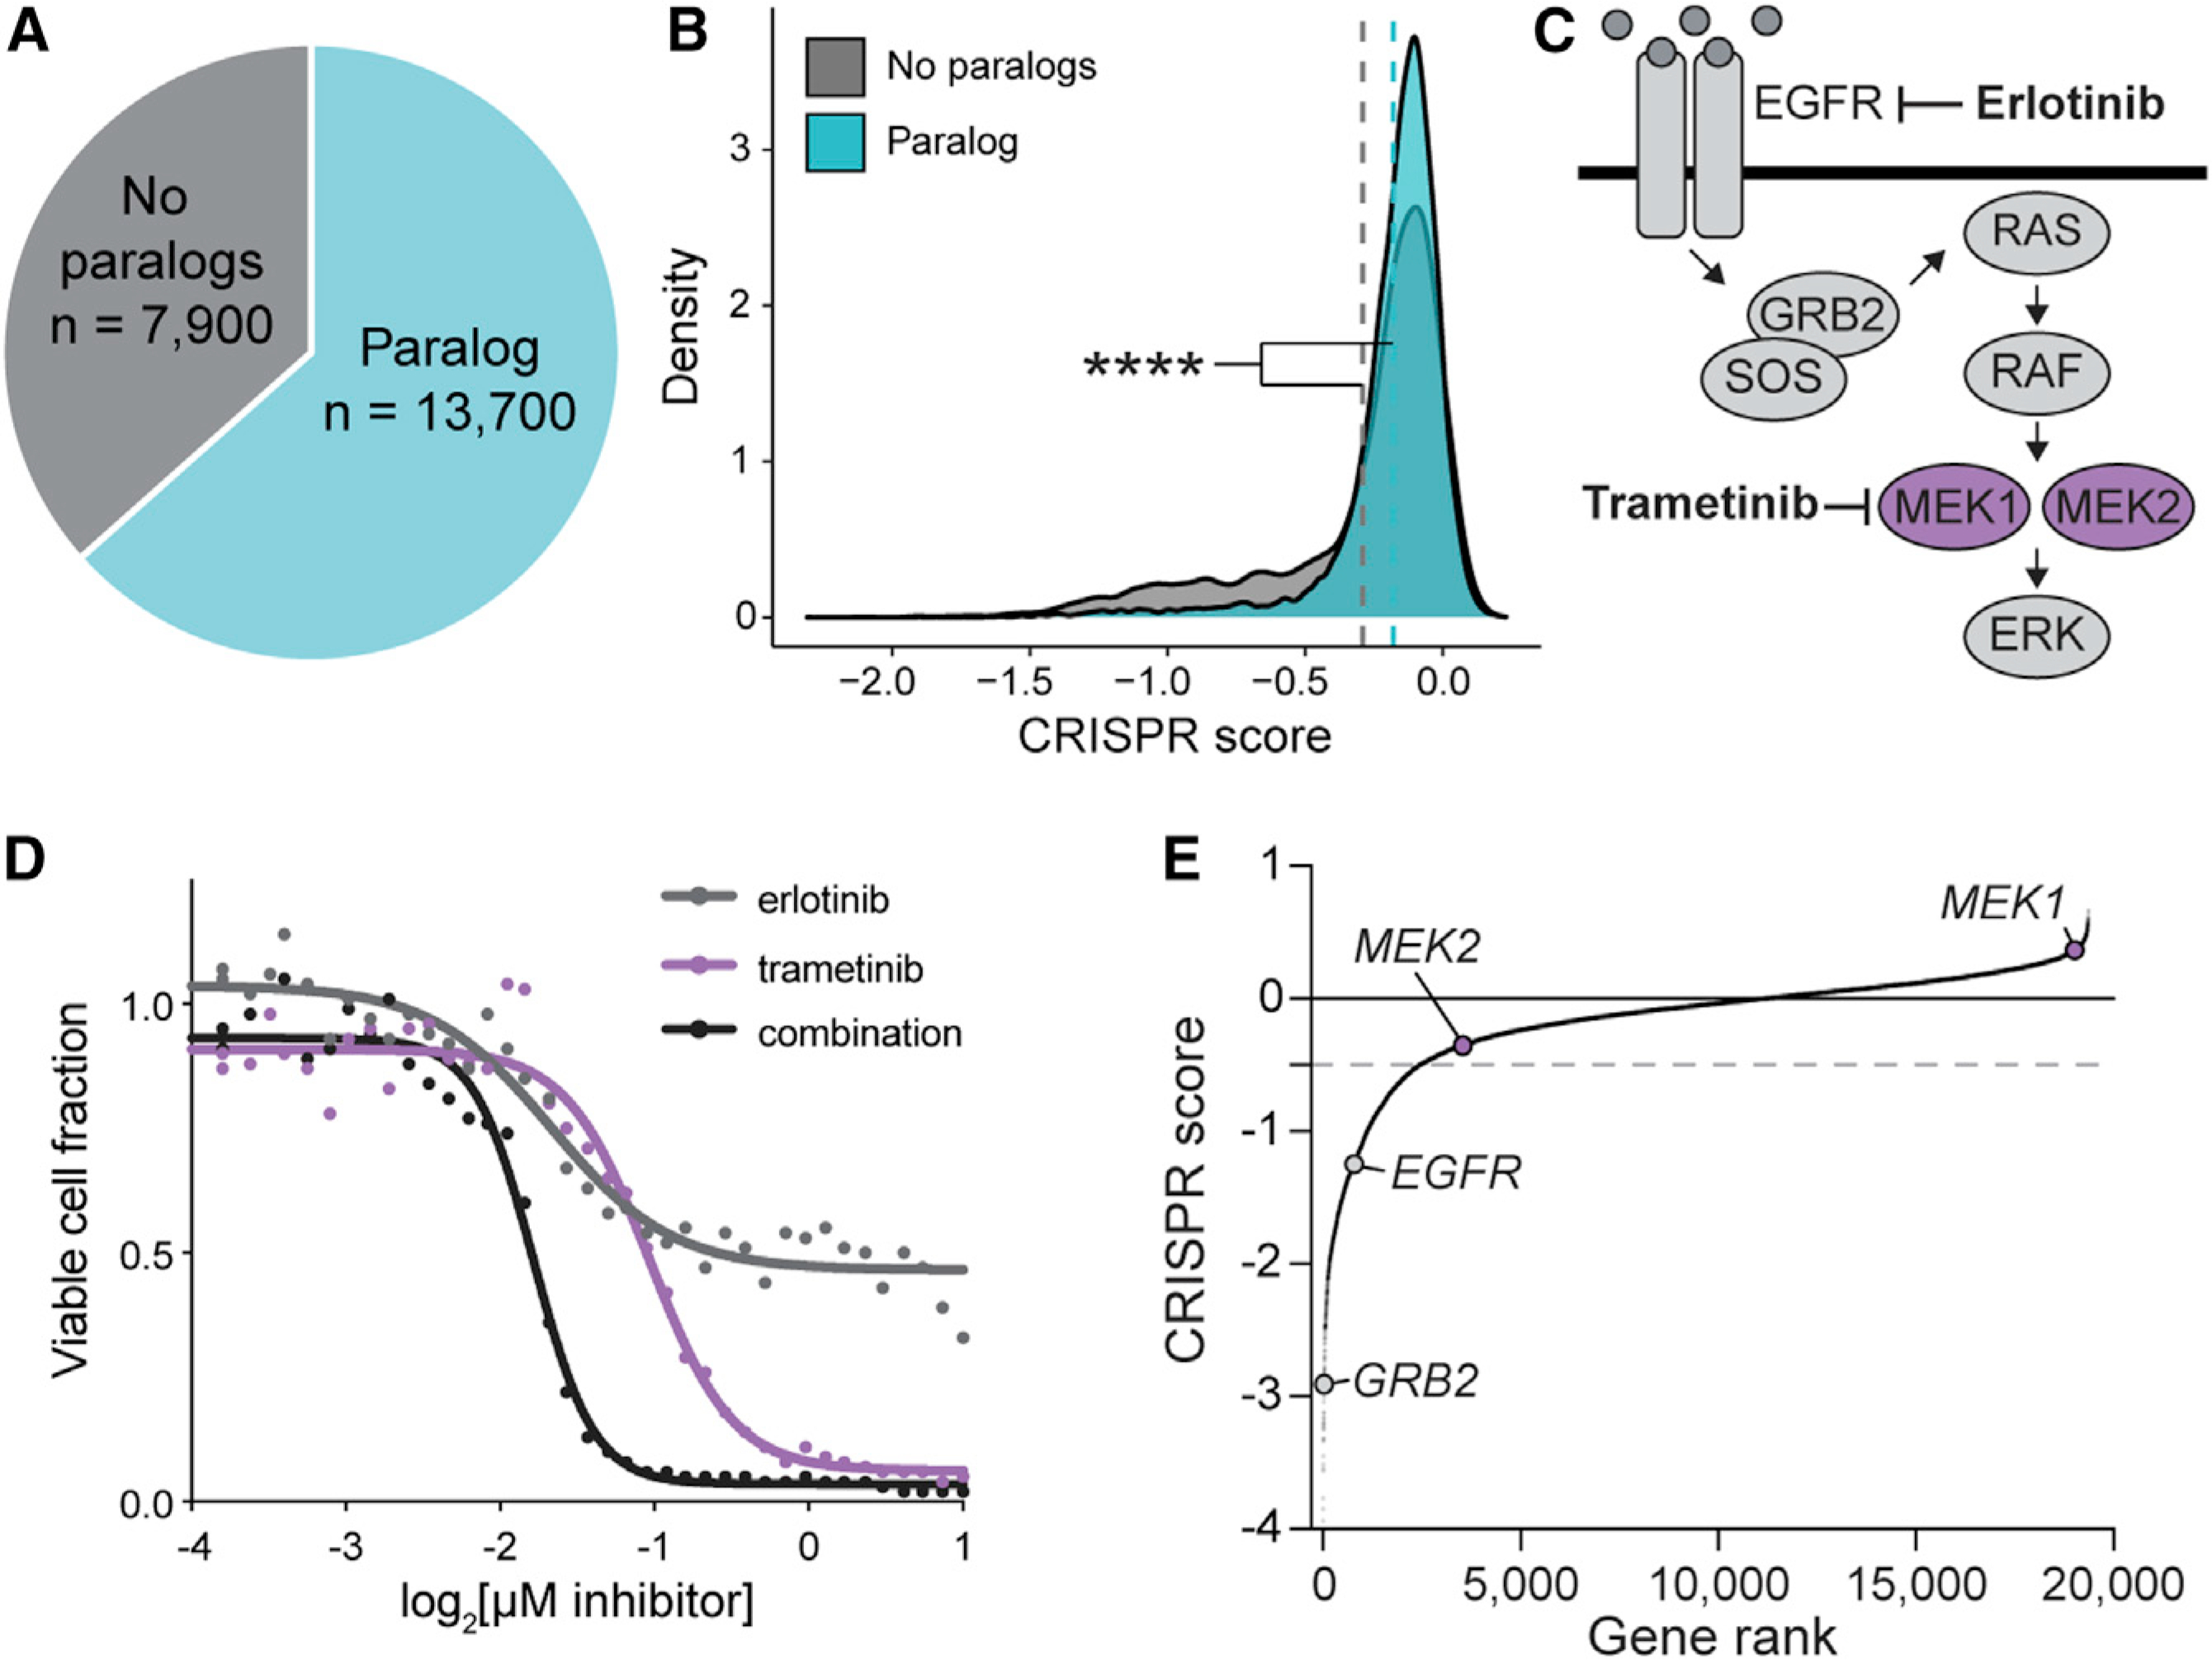
(A) Pie chart of human genes classified based on whether they are part of a paralog gene family with 10%–99% amino acid sequence identity.
(B) Density plot of CRISPR scores for a single-gene CRISPR KO screen in PC9 lung adenocarcinoma cells. Data are from Vichas et al. (2021). Dashed lines indicate the mean CRISPR score of genes in each group. **** indicates p < 2.20e–16 by one-tailed K-S test.
(C) Schematic of the EGFR/Ras/MAPK signalling pathway.
(D) Dose response curve of PC9-Cas9-EGFRT790M/L858R lung adenocarcinoma cells treated with erlotinib, trametinib, or a 1:1 combination of both drugs. The fraction of viable cells was determined by CellTiterGlo luminescence after 96 h of treatment. Data were re-analyzed from a larger drug screen from Berger et al. (2016).
(E) Rank plot of CRISPR scores from an erlotinib sensitization screen in PC9-Cas9-EGFRT790M/L858R cells (Vichas et al., 2021). MEK1 or MEK2 single-gene KO does not result in significantly decreased cell growth. Gray dashed line indicates the threshold for negative selection (−0.5).