
Figure 2. The pgPEN CRISPR library enables GI mapping of 1,030 human paralog pairs.
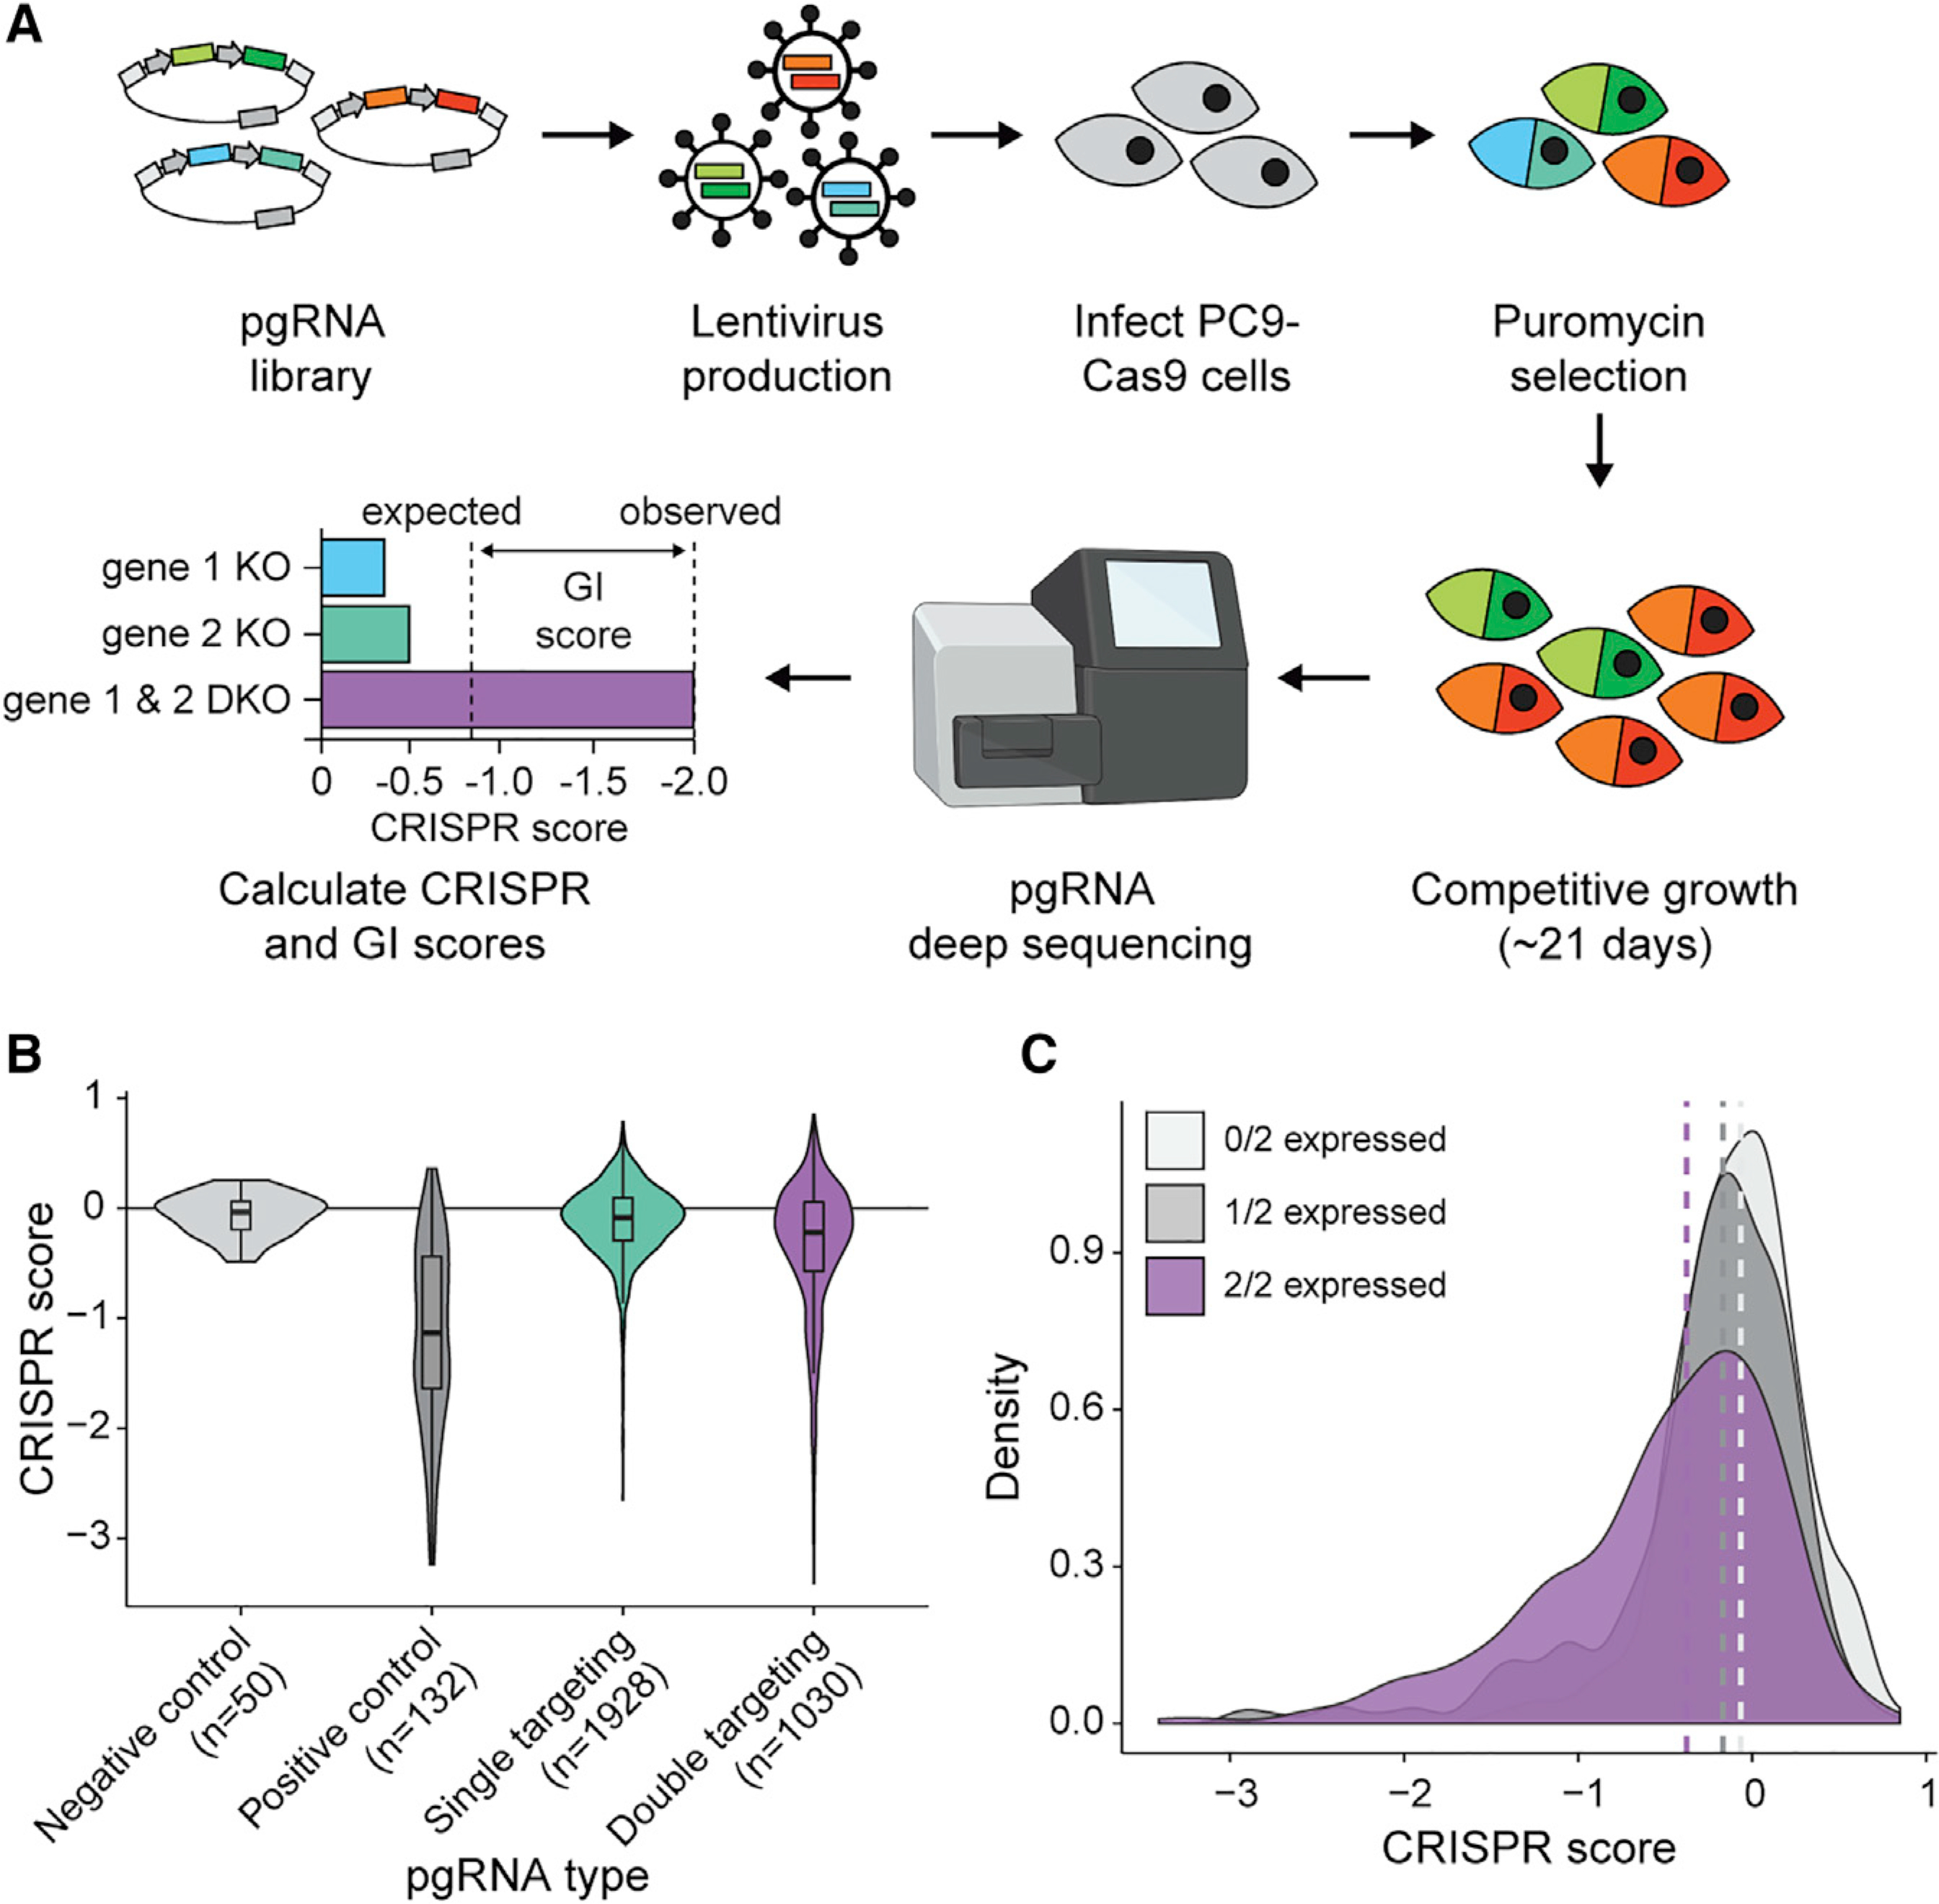
(A) Schematic of pgPEN screening approach for paralog GI mapping.
(B) Violin plots of target-level CRISPR scores for negative control (double non-targeting control), positive control (single KO pgRNAs targeting known essential genes), all other single KO pgRNAs, and DKO pgRNAs in the PC9 screen. The double-targeting pgRNA group had significantly lower CRISPR scores than did the single-targeting pgRNA group (p < 2.20e–16 by one-tailed K-S test).
(C) Density plot of target-level CRISPR scores for DKO pgRNAs grouped by whether zero, one, or both targeted genes are expressed (TPM ≥ 2) in PC9 cells. Dashed lines indicate the median CRISPR score for each group. pgRNAs targeting expressed genes had significantly lower CRISPR scores than those targeting two unexpressed genes for both the 2/2 genes expressed (p < 2.20e–16 by one-tailed K-S test) and 1/2 genes expressed (p = 4.03e–03 by one-tailed K-S test) groups.
See also Figures S1 and S2 and Tables S1, S2, and S3.