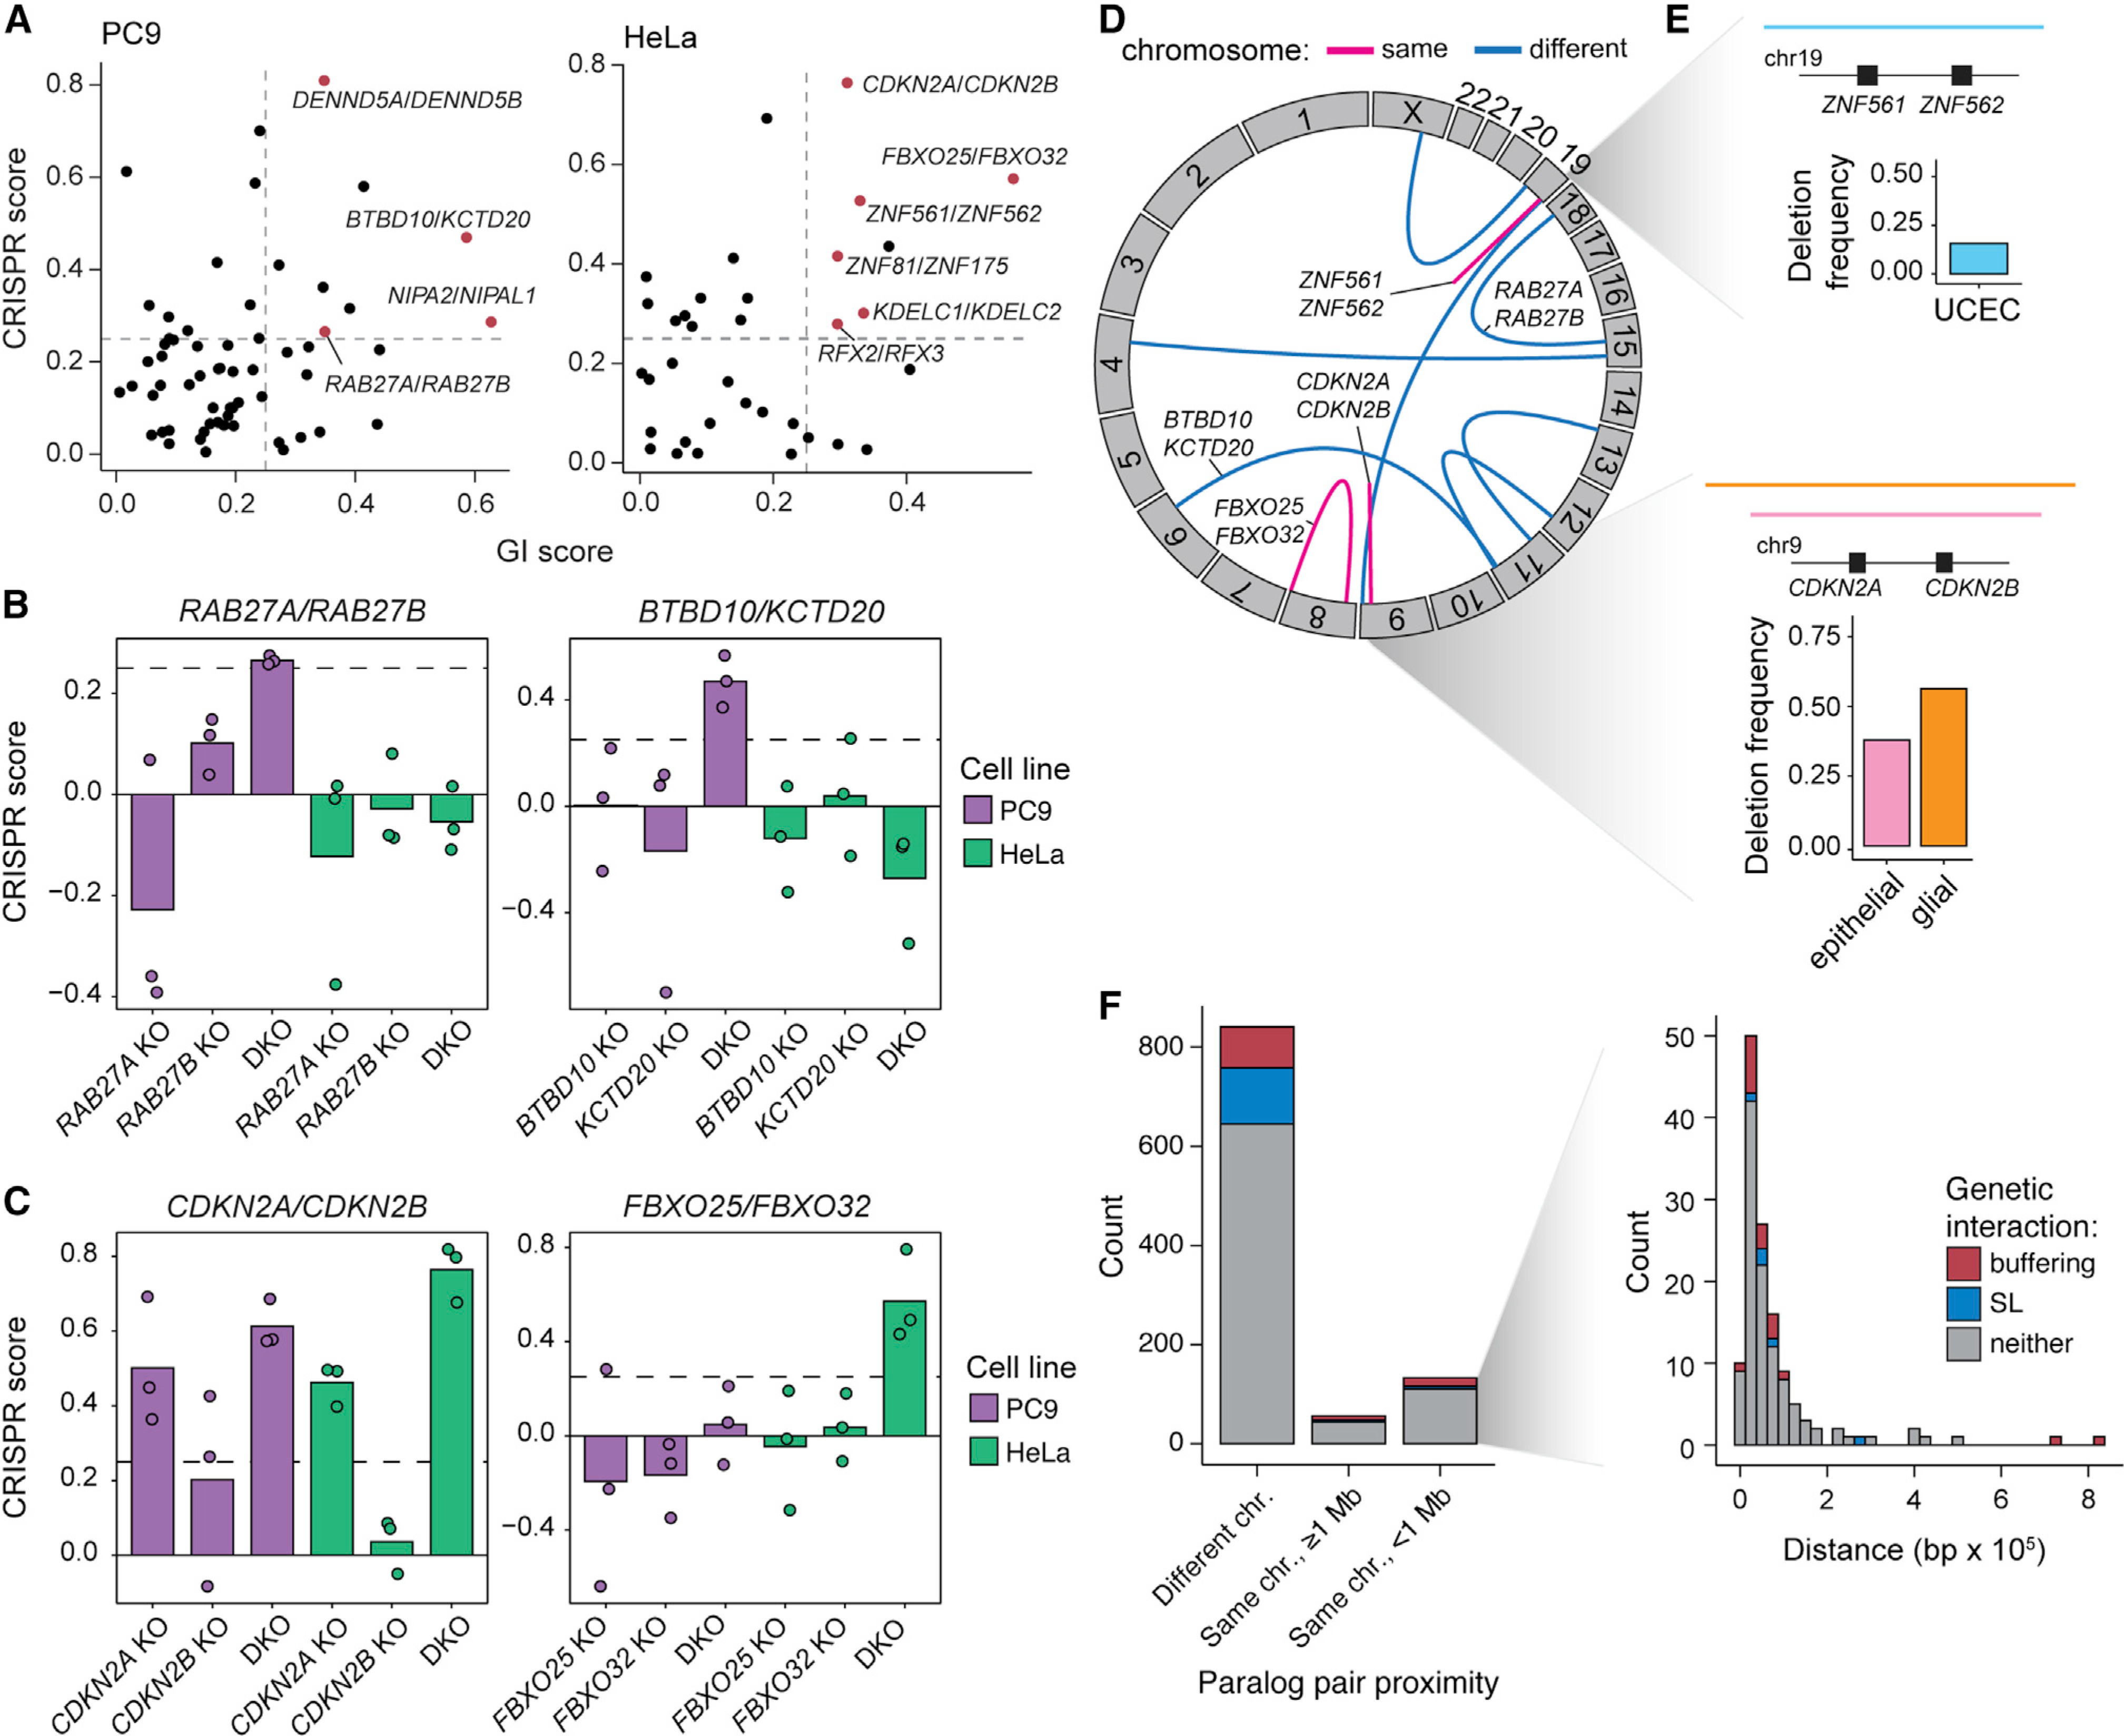
Figure 6. Paralog buffering interactions include tumor suppressor paralogs.

(A) Identification of tumor suppressor paralog interactions (GI score > 0.25; FDR < 0.1; CRISPR score > 0.25).
(B) CRISPR scores of PC9-specific tumor suppressor paralog pairs. Data shown are the mean of three biological replicates with replicate data shown in overlaid points. Dashed lines indicate CRISPR score = 0.25.
(C) CRISPR scores of HeLa-specific tumor suppressor paralog pairs. Data shown as in (B).
(D) Circos plot showing the genomic locations of tumor suppressor paralog pairs. Blue arcs indicate paralog pairs located on different chromosomes, while pink arcs represent paralog pairs located on the same chromosome.
(E) Top: diagram of a recurrent deletion seen in uterine corpus endometrial carcinoma (UCEC) data from The Cancer Genome Atlas (TCGA) that spans the genomic locus containing ZNF561 and ZNF562 and a bar plot indicating the deletion frequency. Bottom: diagram of recurrent deletions in epithelial and glial cancers that span the genomic locus containing CDKN2A and CDKN2B and a bar plot showing the deletion frequency in each cancer subtype.
(F) Genomic distance between paralogs for the 1,030 paralogs pairs included in the pgPEN library in three proximity categories: on different chromosomes, on the same chromosome but ≥ 1 Mb apart, and on the same chromosome within 1 Mb. Inset: histogram of paralog distance for pairs that are within 1 Mb of one another.
