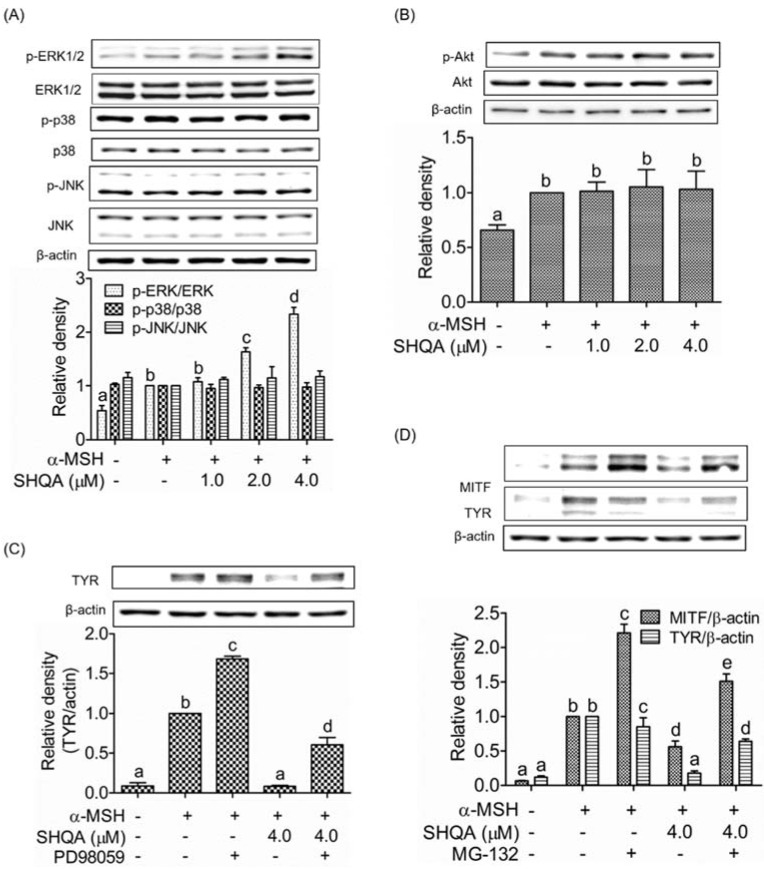
Figure 5.
Effect of SHQA on melanogenic upstream signaling pathways in B16F10 cells. After pre-treatment of SHQA for 1 h, cells were treated with α-MSH (1.0 μM) for 1 h with or without SHQA. Western blotting was performed for (A) MAPKs and (B) AKT. (C) After pre-treatment of SHQA for 1 h with or without PD98059 (15.0 μM), cells were treated with α-MSH for 48 h. Western blotting was performed to detect tyrosinase. (D) After pre-treatment of SHQA for 1 h with or without MG-132 (70 nM), cells were treated with α-MSH for 48 h. Western blotting was performed for MITF and tyrosinase. The band images were measured by densitometry and shown as bar graphs. Data are expressed as the mean ± standard deviation (SD) (n = 3). Different superscripts represent statistical significance at p < 0.05.

