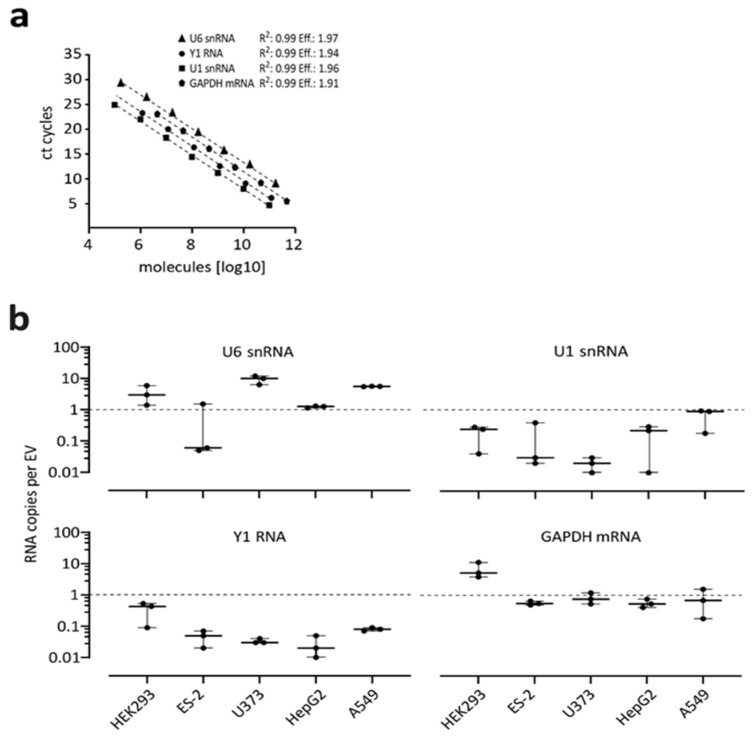
Figure 3.
Absolute quantification of endogenous RNAs in EVs: U6 snRNA, Y1 RNA, U1 snRNA, and GAPDH mRNA. (a,b) Absolute quantification of copy numbers per EV for four different RNAs. For standard curves with equations and amplification efficiencies used for absolute quantification by RT-qPCR, see panel a. EVs were purified from five different cell lines (HEK293, ES-2, U373, HepG2, and A549), followed by RT-qPCR assays (panel b; copy numbers per EV in log10-scale; n = 3, with mean and standard deviations).

