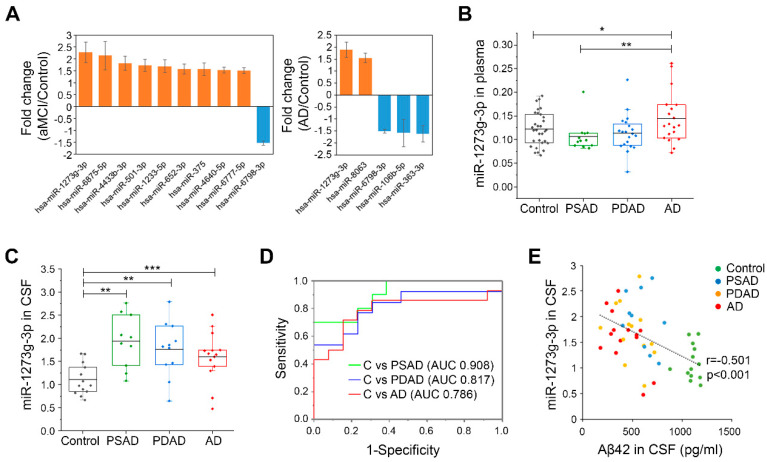
Figure 1.
Analysis of miRNAs in plasma and CSF from four groups of AD. (A) Alzheimer’s disease (AD)-associated miRNAs selected by microarray analysis of miRNAs in plasma from 24 amnestic mild cognitive impairment (aMCI) patients, 36 AD patients, and 36 controls (absolute fold change > 1.5; p < 0.05, Student’s t-test). Bar graphs show fold change of miRNAs in aMCI (left) and AD (right) relative to the control. Orange and blue bars present up- and downregulated miRNAs, respectively. Data are presented as mean ± SEM. (B) Quantification of miR-1273g-3p in plasma from the presymptomatic AD (PSAD, n = 12), prodromal AD (PDAD, n = 20), AD (n = 20), and control (n = 31) groups, as assessed by qPCR. Column scatter plots present the level of miR-1273g-3p in individual samples. Each data point is the average value obtained from two or four independent analyses performed using the same plasma sample. The data were normalized by average Ct values of four control miRNAs (miR-191-5p, miR-451a, miR-425-5p, and miR-23a-3p). * p < 0.05, ** p < 0.01 (Student’s t-test). (C) Quantification of miR-1273g-3p in cerebrospinal fluid (CSF) from the PSAD (n = 10), PDAD (n = 13), AD (n = 14), and control (n = 13) groups, as assessed by qPCR. Column scatter plot presents the level of miR-1273g-3p for individual samples. Data were normalized by miR-23a-3p, which was the only utilized normalization-control miRNA detectable in CSF. ** p < 0.01, *** p < 0.001 (Student’s t-test). (D) Receiver operating characteristic (ROC) curves for control vs. PSAD (green line), control vs. PDAD (blue line), and control vs. AD (red line), as generated using qPCR data for miR-1273g-3p in CSF. The areas under the ROC curve (AUC) of each analysis are presented in the plot. (E) Correlation plot of the miR-1273g-3p level in CSF versus the Aβ42 level in CSF (n = 50). Data on the Aβ42 level in CSF were obtained from the National Research Center for Dementia (Chosun University, Gwangju, Korea). Significance of correlation was tested by Pearson’s correlation. The upper and lower limits of the box plot indicate the 75th and 25th percentiles, and the line in each box indicates the mean of each group. C, control.

