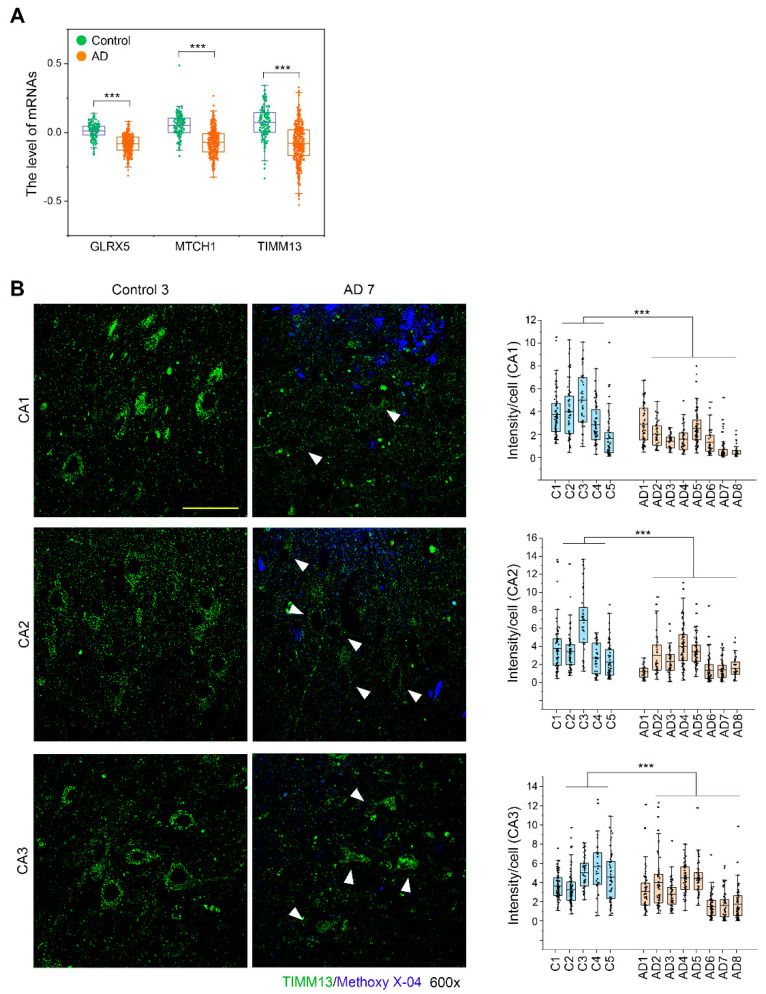
Figure 7.
TIMM13 is downregulated in hippocampi of AD patients. (A) Expression levels of GLRX5, MTCH1, and TIMM13 mRNAs in human prefrontal cortex of AD patients (GN368, n = 383) and controls (GN367, n = 165). (B) Fluorescence immunohistochemistry of TIMM13 (green) with methoxy-X04 staining (blue) in human post-mortem hippocampal tissues from 8 AD patients and 5 controls. Representative images of the stratum pyramidal layer of CA1, CA2, and CA3 are shown. Arrows in images of AD patients indicate pyramidal neurons. Column scatter plots present the intensity of TIMM13 staining per each pyramidal neuron. The upper and lower limits of the box plot indicate the 75th and 25th percentiles; the line in each box indicates the average of each group; and whiskers indicate outliers. Scale bar: 50 μm. *** p < 0.001; n.s., non-significant (Student’s t-test).

