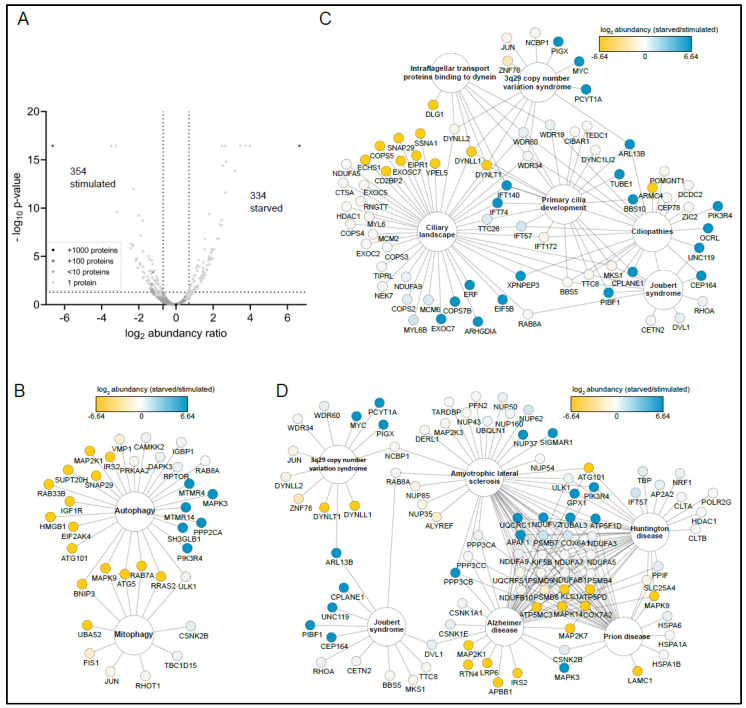
Figure 3.
Interactome analysis revealed SZT2 interactors that preferentially bind upon starvation or stimulation. (A) Volcano plot of all identified proteins interacting with SZT2 with the abundancy ratio of interacting proteins upon starvation versus stimulation. The gray color scale depicts the number of proteins that have the same abundance and p-value. Proteins binding with a higher affinity to SZT2 upon starvation have a p-value below 0.05 and an abundance ratio of 1.5 over proteins binding upon stimulation (within right dotted lines). Map of (B) autophagy, (C) cilia-associated and (D) neurological disorder-associated terms, depicting identified proteins found in the SZT2 interactome. The color code shows the log2-abundance ratio of the single proteins with proteins binding SZT2 upon starvation colored in blue and upon stimulation colored in yellow.

