Figure 5.
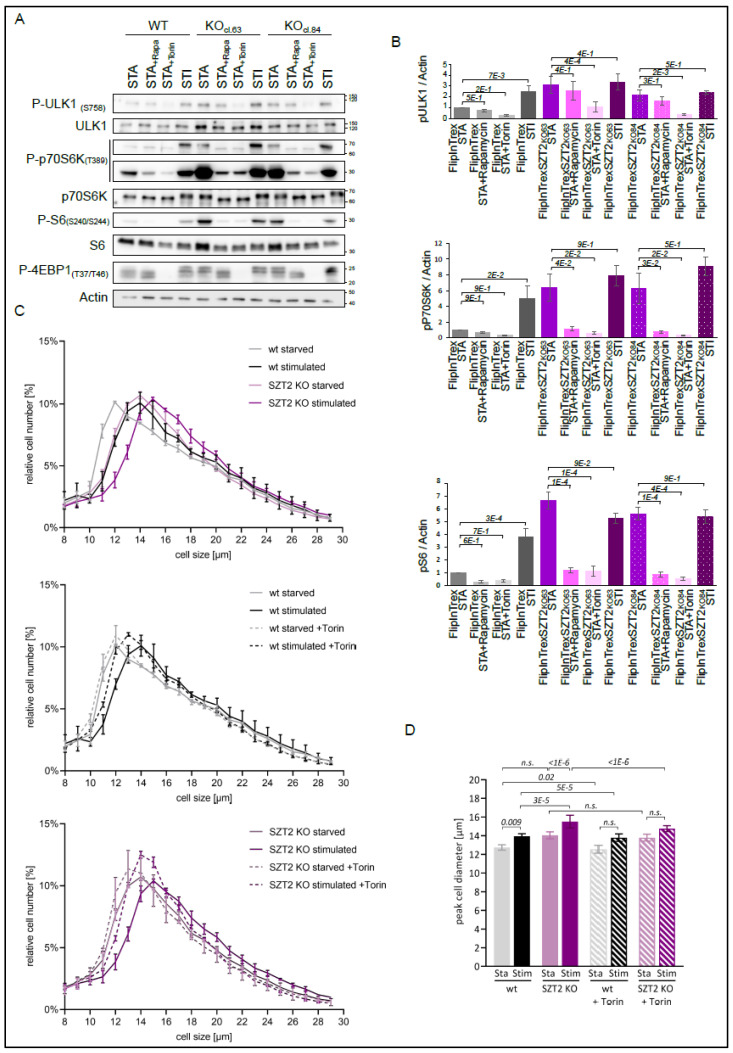
Torin and Rapamycin reduce the mTORC1 hyperactivity seen in SZT2 KO cells. (A) Wild type and SZT2 KO cells were starved for amino acids for 1 h followed or not by restimulation for 20 min. In addition, cells were treated with either Rapamycin or Torin during starvation. Obtained lysates were separated by SDS-PAGE and the presence of the indicated proteins determined by immunoblotting. Data are representative of three independent experiments. (B) Analysis of the regulation of selected proteins detected in (A). Graphics display the mean + SEM. (C) Control and SZT2 KO cells were starved for amino acids for 3 h and restimulated for another 3 h prior to harvesting. The cell diameter of three biological replicates per cell line and condition were analyzed. Graphics represent the cell size of at least 45,000 viable cells per condition plotted against their relative number ± standard dev. (D) Quantification of the peak cell diameter of each cell line analyzed in (C). Graphic represents the peak diameter in the different conditions ± standard dev. The statistical significance was analyzed using a nonparametric Kruskal–Wallis test and subsequent Dunn’s test with the p-value depicted in italics.

