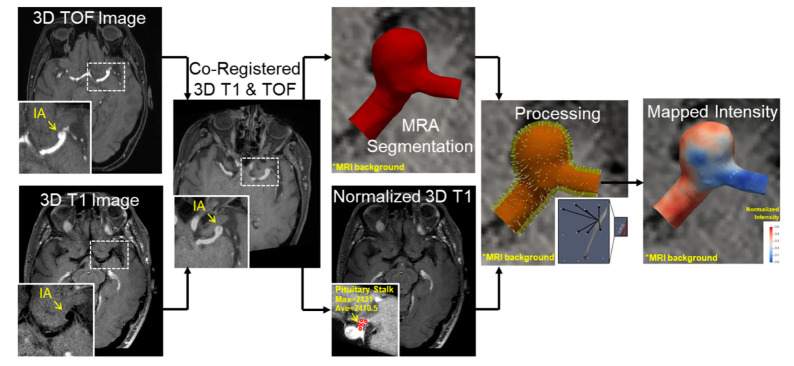
Figure 1.
Pipeline for vessel wall enhancement quantification—Post-contrast MRI and MRA images are taken as inputs for this pipeline. The MR image is first normalized by the average contrast intensity at the pituitary stalk. The MR image is then registered on to the MRA image. The MRA image is segmented to generate a surface file. Following this, the region of interest is identified and then the voxels normal to each surface are interpolated on to the surface to generate the final contour as shown.

