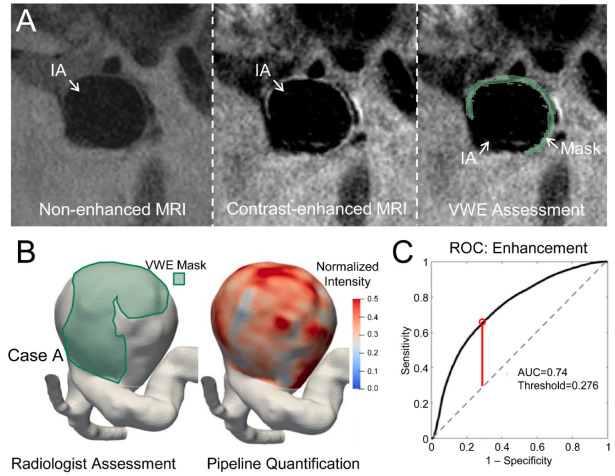
Figure 2.
Identifying optimal threshold in the training dataset. (A). A cross-sectional slice of non-enhanced and contrast-enhanced MR images and the corresponding marked mask of a representative ICA case (Case A). (B). Reconstructed mask (marked in green) and the mapped intensities. (C). An ROC curve of the cumulative training set. The red line represents the location of maximal Youden’s J index.

