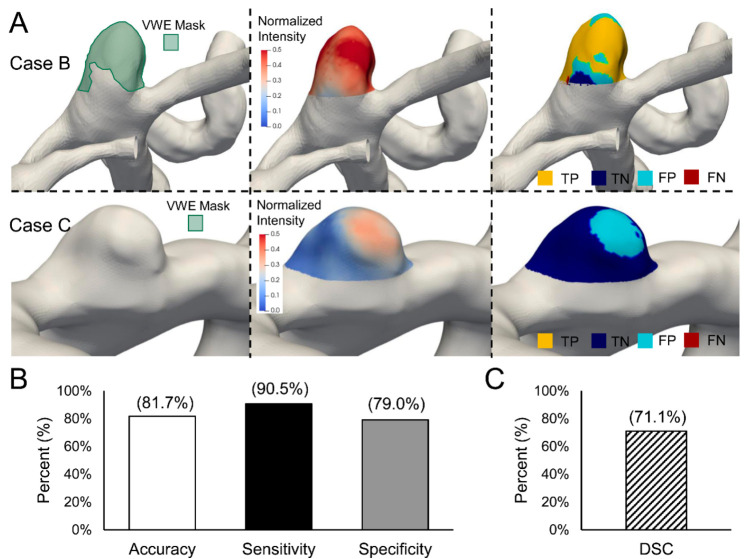
Figure 3.
Results of VWE detection in the testing dataset. (A). Masks, mapped intensities and testing plots of 2 representative cases. Case B had a mask and Case C did not. The yellow, blue, cyan and red represent true positive (TP), true negative (TN), false positive (FP) and false negative (FN) classification of faces based on clinician marked voxels. Ideal case would have no FP and FN voxels. (B). Cumulative accuracy, sensitivity and specificity of all the faces in all the cases. (C). Average dice similarity coefficient (DSC) of only the cases with marked masks (n = 4) in the testing cohort.

