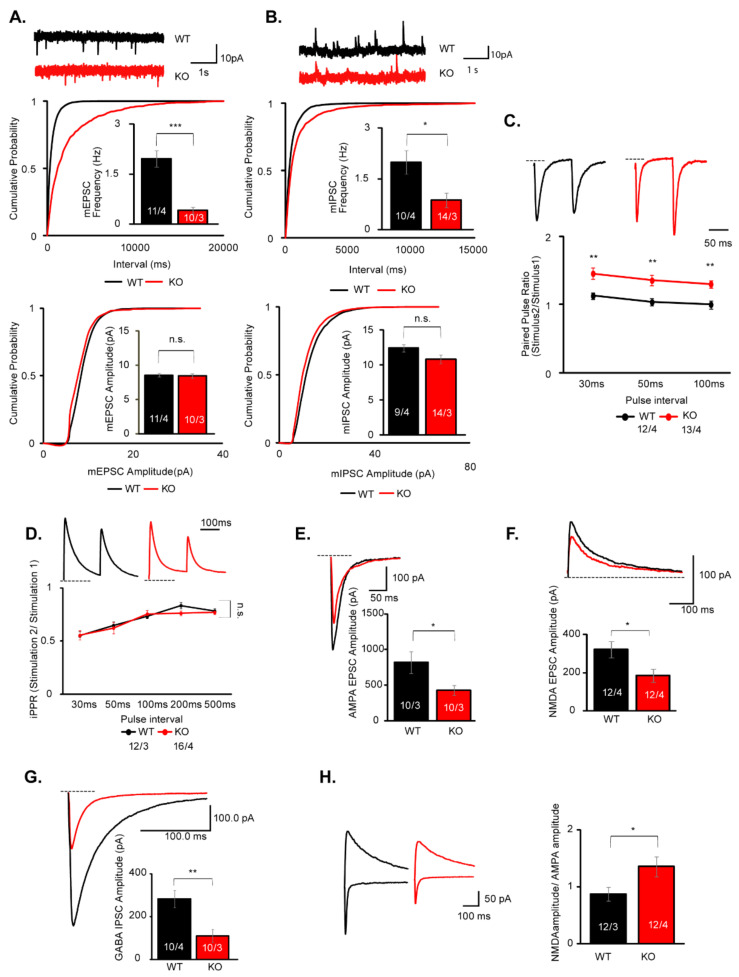
Figure 3.
AMPAR, NMDAR, and GABAR-mediated synaptic transmissions are decreased in pyramidal neurons in layer 5 of the mPFC in P14-P19 IQSEC2 KO mice. (A) Sample traces and summary graphs for mEPSCs in pyramidal neurons in layer 5 of the mPFC in wild-type (WT) and IQSEC2 KO (KO) mice. The frequency, but not amplitude, of mEPSCs is decreased in IQSEC2 KO mice. (B) Sample traces and summary graphs for mIPSCs in pyramidal neurons in layer 5 of the mPFC in wild-type (WT) and IQSEC2 KO (KO) mice. The frequency, but not amplitude, of mIPSCs is decreased in IQSC2 KO mice. (C) Sample traces and summary graph for the paired-pulse ratio of evoked EPSC in wild-type (WT) and IQSEC2 KO (KO) mice. The paired-pulse ratio is increased in IQSEC2 KO mice in 30, 50, and 100 ms stimulation intervals, suggesting that the release probability is decreased in the IQSEC2 KO neurons. (D) Sample traces and summary graph for the paired-pulse ratio of evoked IPSC in wild-type (WT) and IQSEC2 KO (KO) mice. The paired-pulse ratio is unchanged in IQSEC2 KO mice. (E) Sample traces and summary graph for evoked AMPA EPSC in wild-type (WT) and IQSEC2 KO (KO) mice. The amplitude of evoked AMPA EPSC is decreased in IQSEC2 KO mice. (F) Sample traces and summary graph for evoked NMDA EPSC in wild-type (WT) and IQSEC2 KO (KO) mice. The amplitude of evoked NMDA EPSC is decreased in IQSEC2 KO mice. (G) Sample traces and summary graph for evoked GABA IPSC in wild-type (WT) and IQSEC2 KO (KO) mice. The amplitude of evoked GABA IPSC is decreased in IQSEC2 KO mice. (H) Sample traces and summary graph for the NMDA/AMPA ratio in wild-type (WT) and IQSEC2 KO (KO) mice. The NMDA/AMPA ratio is increased in IQSEC2 KO mice. Data are means ± SEM (numbers of neurons/independent animals examined are shown in graphs). Statistical analyses were performed by Student’s t-test (* p < 0.05; ** p < 0.01; *** p < 0.001; n.s. = not significant). Data values used in graphs are shown in Table S2.

