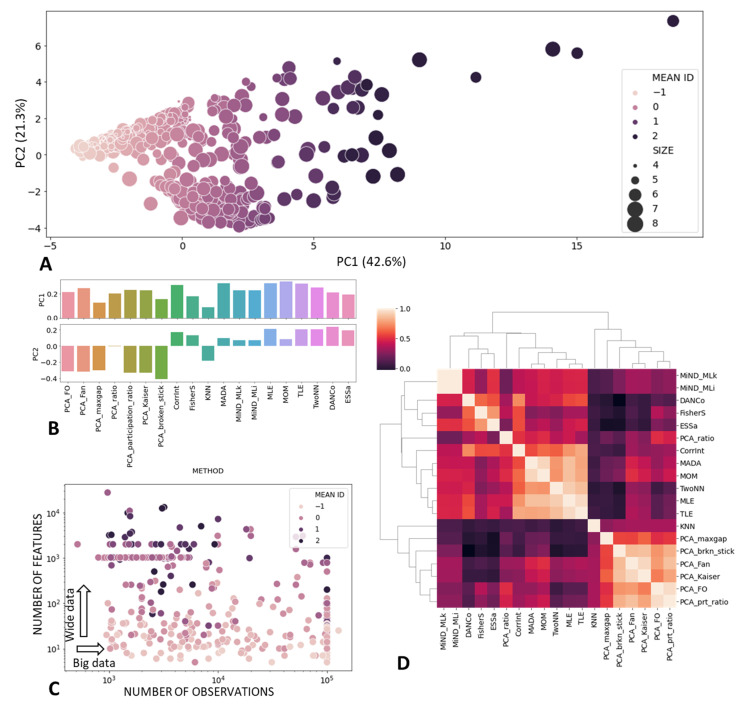
Figure 3.
Characterizing OpenML dataset collection in terms of ID estimates. (A) PCA visualizations of datasets characterized by vectors of 19 ID measures. Size of the point corresponds to the logarithm of the number of matrix entries (). The color corresponds to the mean ID estimate taken as the mean of all ID measure z-scores. (B) Loadings of various methods into the first and the second principal component from (A). (C) Visualization of the mean ID score as a function of data matrix shape. The color is the same as in (A). (D) Correlation matrix between different ID estimates computed over all analyzed datasets.

