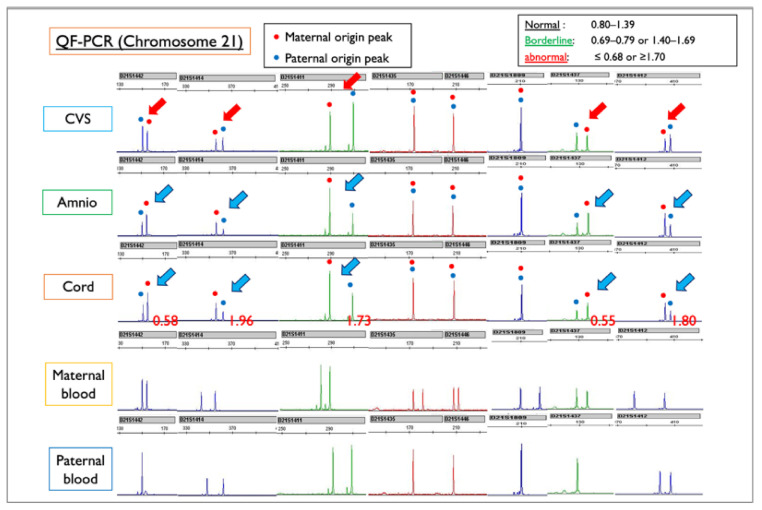
Figure 10.
QF-PCR results for each sample of Case Mo4, compared with the maternal and paternal blood sample. CVS: chorionic villus sample; Amnio: amniotic fluid sample. Red figures ≤0.68 or ≥1.70 indicate Trisomy 21. In this case, maternal and paternal peak patterns show the normal disomy of chromosome 21. In the amniotic fluid and cord samples, the blue arrows indicate that the peak of chromosome 21 of maternal origin is higher than that of paternal origin, a finding that is suggestive of T21. In contrast, in the CVS sample, the red arrows indicate that the peak of the mother-derived chromosome 21 is lower than that of the father-derived chromosome 21, suggesting the presence of more M21 than T21. From the QF-PCR analysis, we concluded that the Robertsonian T21 was created as an isochromosome with a duplicated long arm of maternal chromosome 21.

