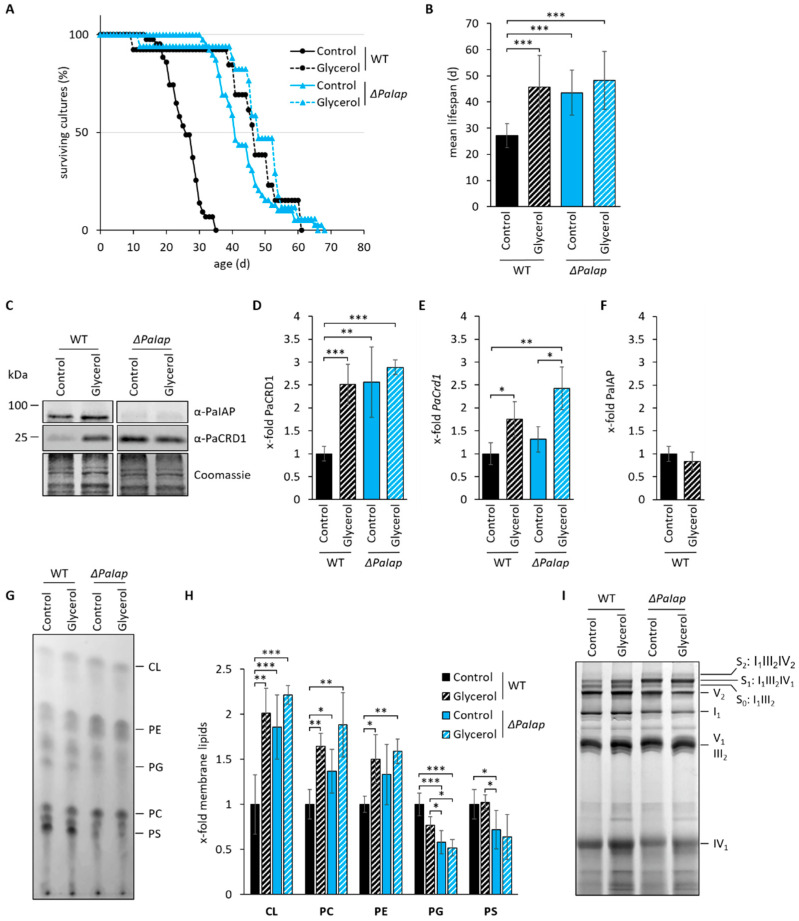
Figure 6.
Absence of PaIAP alters mitochondrial protein and PL composition comparable to those observed in respiratory active mitochondria. (A): Lifespan analysis of wild type (WT) and ΔPaIap grown on M2 either with dextrin (control, glycolytic condition) or glycerol (respiratory condition) as primary carbon source at 27 °C. (B): Mean lifespan from (A). Data represent mean ± SD (wild type (control): n = 43; wild type (glycerol): n = 13; ΔPaIap (control): n = 39; ΔPaIap (glycerol): n = 17). (C): Western blot analysis of isolated mitochondria of 7-day-old WT and ΔPaIap grown on CM medium with either glucose (control) or glycerol as primary carbon source. Coomassie staining was used as loading control. (D): Quantification of PaCRD1 in (C). PaCRD1 levels were determined and related to wild type (set to 1). Data represent mean ± SD (control: n = 5; glycerol n = 3). (E): PaCrd1 transcript analysis of 5-day-old wild type and ΔPaIap grown on M2 medium either with dextrin (control) or glycerol. PaCrd1 transcript level was analyzed by RT-qPCR and normalized to PaPorin expression level. Data represent mean ± SD (wild type (control): n = 6; ΔPaIap (control): n = 3; glycerol: n = 3). (F): Quantification of PaIAP in (C). PaIAP levels were determined and related to wild type (set to 1). Data represent mean ± SD (n = 3). (G): One-dimensional TLC analysis of mitochondrial PLs of the wild type (WT) and ΔPaIap grown on glucose (control) or glycerol containing CM medium. PL extraction and analysis was performed as described in Material and Methods. (H): Quantification of PL spots in (G). Intensity of each PL spot was measured and related to the intensity of the whole track. Wild-type values of each PL were set to 1. Data represent mean ± SD (wild type (control): n = 5; wild type (glycerol): n = 3; ΔPaIap (control): n = 11; ΔPaIap (glycerol): n = 4). (I): BN-PAGE analysis of isolated mitochondria of 7-day-old WT and ΔPaIap strains grown either under glycolytic (Control) or respiratory (Glycerol) conditions. Subscripted numbers represent degree of oligomerization per RC complex. S0 to S2 represent different RCS depending on amount of complex IV per supercomplex. * p < 0.05; ** p < 0.01; *** p < 0.001.

