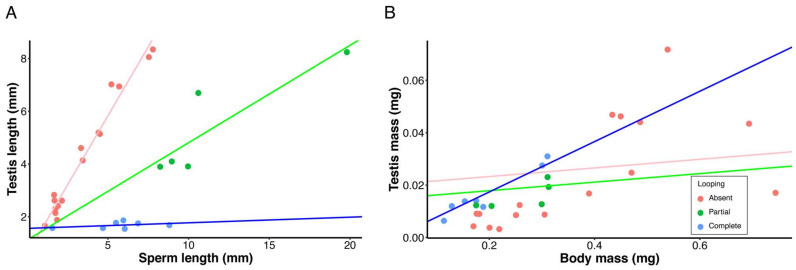
Figure 7.
Relationships between mean (A) testis length and sperm length, and (B) dry testis mass and male dry body mass for all species examined. PGLS regressions were conducted for species with complete cyst looping (blue lines), partial cyst looping (green lines) and for species with no cyst looping (pink lines). Panel B is presented only as visual representation of the testis mass-body mass relationship, as all interpretation of the evolution of testis mass among these species is based on multiple regression (Table 2A). Note that the scatterplot represents the mean trait values for each species examined, whereas the regression lines are the lines of best fit on the PGLS regression (see Methods for details), that take into account the phylogenetic relations of the observed mean values.

