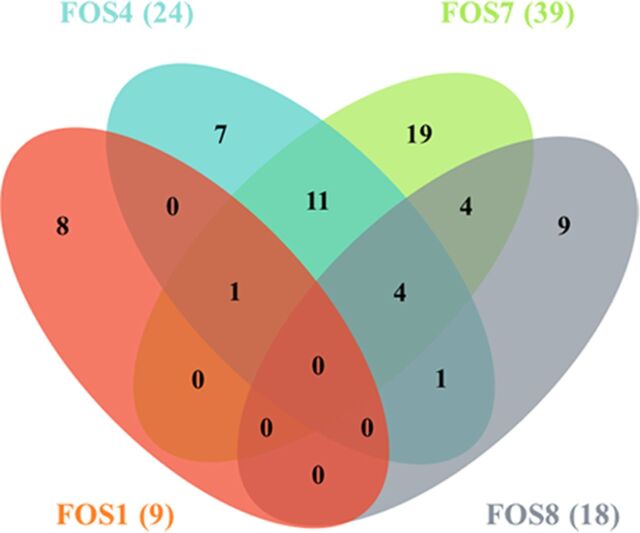
FIG 8.
Common and differential transcriptomic changes of the fosfomycin-resistant mutants. The figure presents a Venn diagram showing the number of genes whose expression changes in the mutants relative to the parental strain were relevant (≥1 log2 fold or ≤−1 log2 fold). The number of genes with changes in each mutant is shown in parentheses. As shown, most transcriptomic changes are specific for each analyzed mutant.

