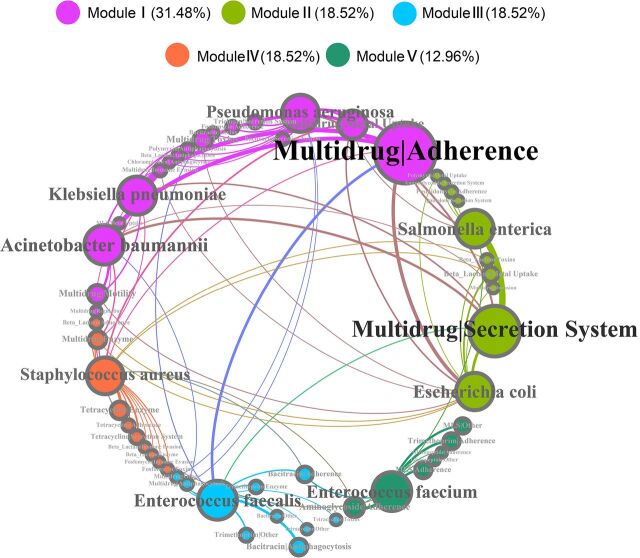
FIG 3.
Network (circular layout) revealing the coexistence patterns between ARG-VF pairs and major pathogen species. The nodes are colored according to modularity class. The connections between each node represent that the relative abundance of ARG-VF pairs in that pathogen species exceeds 0.01. The size of each node is proportional to the weighted number of connections, that is, the average weighted degree.

