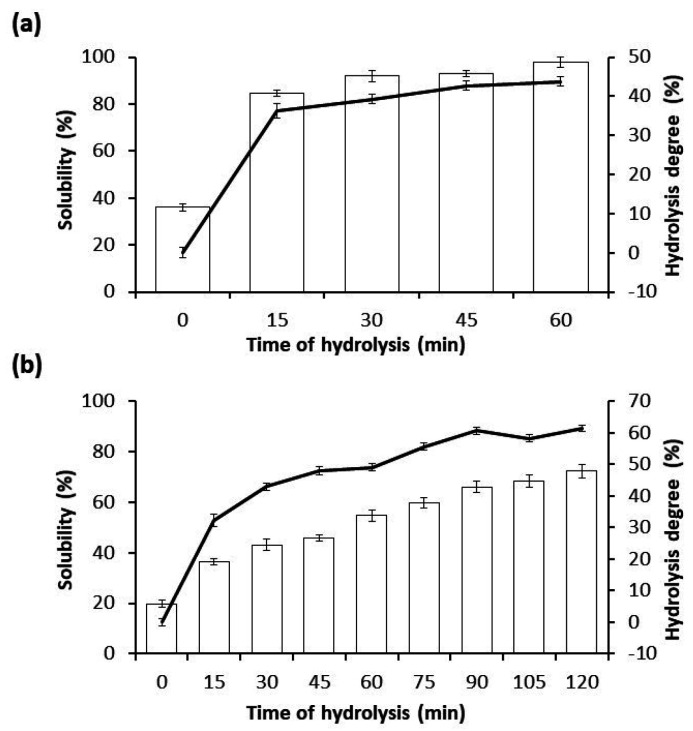
Figure 1.
Time course of the hydrolysis degree (solid curve) of CPI during enzymatic hydrolysis with Alcalase (a) at 0, 15, 30, 45 and 60 min and with Flavourzyme (b) at 0, 15, 30, 45, 60, 75, 90, 105 and 120 min. Additionally, both bar graphs express the % of solubility for each case. Data is ex-pressed as the mean ± standard deviation of at least three determinations.

