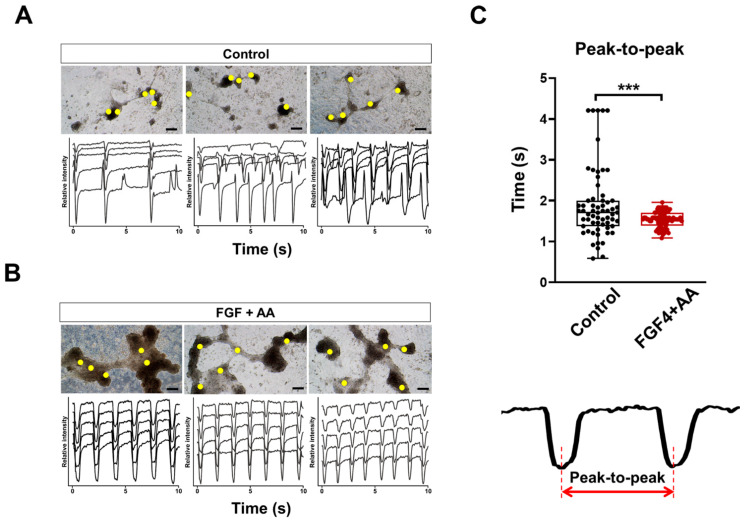
Figure 2.
Co-treatment of FGF4+AA synchronize contraction of BG01 hESC-CMs. Beating characteristics at day 15 in (A) untreated CMs and (B) 10 ng/mL FGF4 + 200 µg/mL AA-treated CMs were assessed by monitoring the light intensity of the selected regions (yellow circles) of interest over a 10 s period. Scale bars = 100 μm. (C) Comparison of peak-to-peak durations. *** p < 0.001 (n = 63 for control and 80 for FGF4+AA; two-tailed unpaired Student’s t-test).

