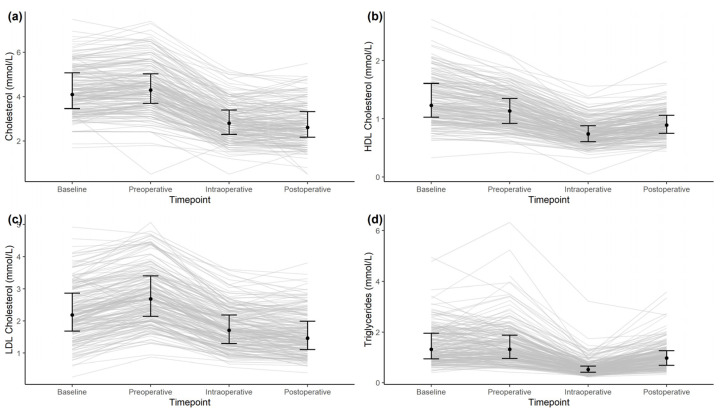
Figure 1.
Time series of cholesterol (a), HDL-C (b), LDL-C (c), and triglycerides (d) for the baseline, pre-operative, intra-operative, and post-operative time points. Shown are medians and interquartile ranges at the different time points (black dots and black lines) and time series of individual patients (grey lines).

