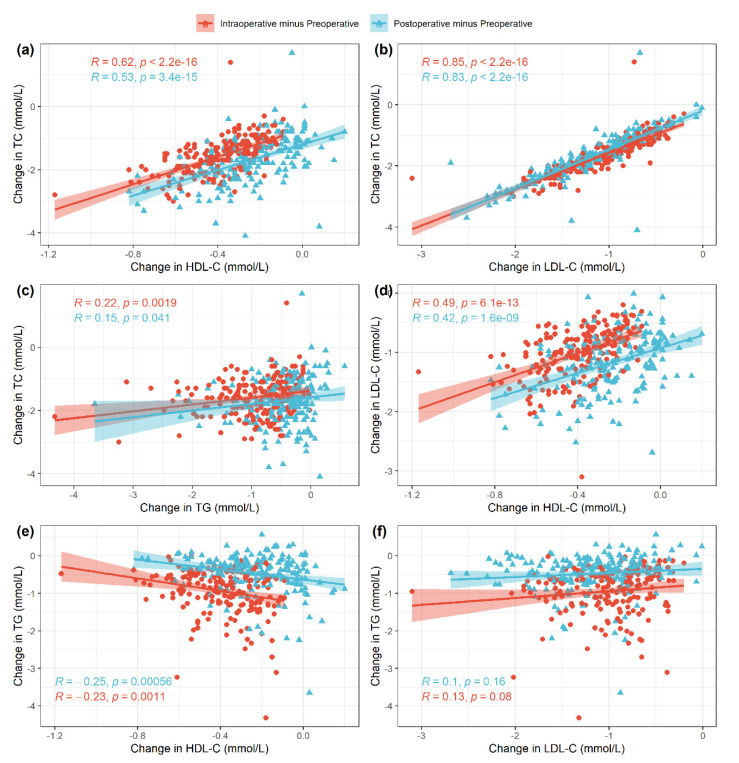
Figure 2.
Pairwise associations across the different variables with associated Pearson correlation coefficients and p-values: TC and HDL-C (a), TC and LDL-C (b), TC and TG (c), LDL-C and HDL-C (d), TG and HDL-C (e), TG and LDL-C (f). For each patient, the changes from preoperative to intraoperative values (red) and from preoperative to postoperative values (blue) are shown.

