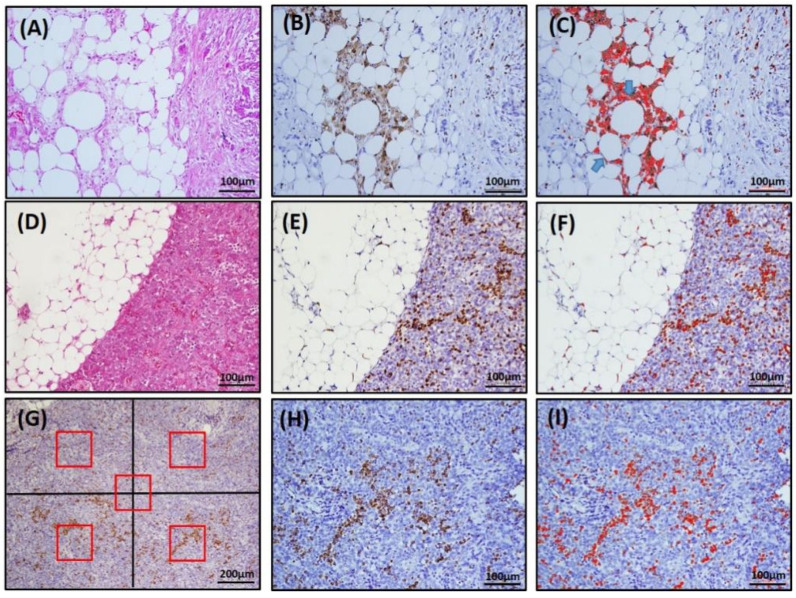
Figure 1.
Representative image of CLS and TAMs by immunohistochemical staining for CD68 and ImageJ software-assisted images. (A,D,G), H&E staining; (B,E,H), IHC CD68 staining; (C,F,I), ImageJ images. In (C), note that there are two adipocytes completely surrounded by CD68-positive macrophages (arrows), counted as two CD68+ CLSs. (G) For TAM density, the area with the greatest concentration of CD68-stained TAMs was identified. Then, five fields (red box, four quadrants and a central area, each field contained 0.04 mm2) under 100× magnification were selected, and the number of CD68+ macrophages was counted under 200× magnification with the assistance of ImageJ software (I).

