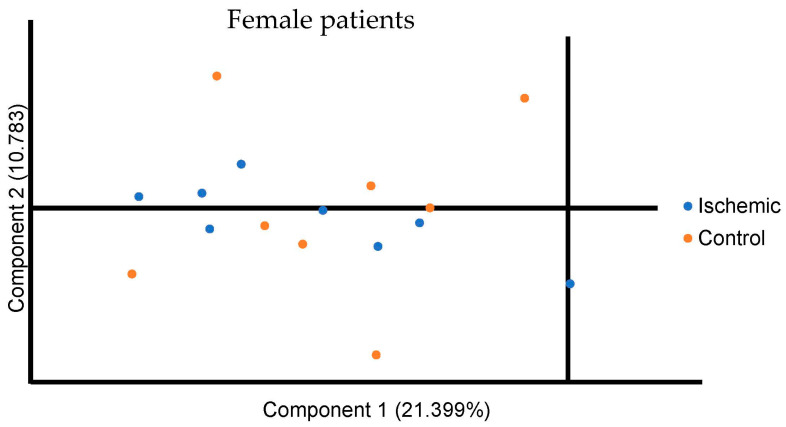
Figure 1.
Principal Component Analysis for all metabolites in the female ischemic and control population. Component 1 is plotted on the x axis and Component 2 is plotted on the Y axis. Component 1 encompassed 21.399% of the variation between participants and Component 2 encompassed 10.783% of the variation between participants.

