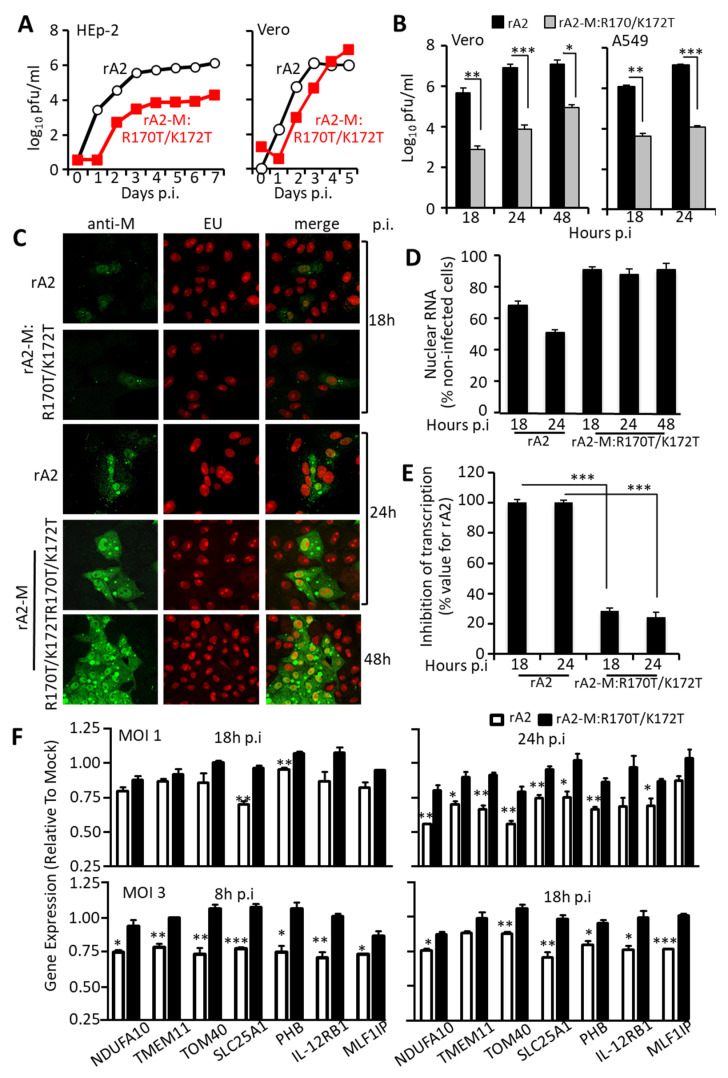
Figure 6.
Recombinant RSV carrying R170T/K172T mutations in M shows impaired virus production and transcriptional inhibition. (A) HEp-2 (left) or Vero (right) cells were infected with recombinant wild type (rA2, open circles) or mutant (rA2-M:R170T/K172T, filled squares) virus at an MOI of 0.01, and samples collected every day for 7 (HEp-2) or 5 (Vero) days and virus titre estimated using immunostaining plaque assay. Results represent the mean +/− SEM (n = 3) for log plaque forming units (pfu)/mL. (B) Vero or A549 cells were infected with wild type rA2 (black columns) or mutant (rA2-M:R170T/K172T, grey columns) at an MOI of 3. Cells were harvested at the indicated times p.i. and analyzed for cell-associated infectious virus by plaque assays. Results represent the mean +/− SEM (n = 3) for log pfu/mL. * p < 0.05, ** p < 0.01, *** p < 0.001. (C) Vero cells were infected with rA2 or rA2-M:R170T/K172T at an MOI of 3 followed by incubation with 1 mM EU for 1 h at 18 or 24 h post-infection. Cells were then fixed, permeabilized, and specifically stained for de novo synthesized RNA and M protein, and CLSM imaged as per the legend to Figure 1. (D) Quantitative analysis for inhibition of de novo RNA synthesis (n = 20) as per the legend to Figure 1. (E) Results from (D) are plotted as the mean inhibition of nuclear transcription as a percentage relative to the value for rA2. *** p < 0.001. (F) A549 cells were infected without (mock) or with wild type rA2 or rA2-M:R170T/K172T at the indicated MOIs, prior to cell lysis at indicated times p.i. and RNA preparation as per the Methods section. Host gene expression was analyzed by qPCR (see Section 2.15), with expression levels relativized compared to gene expression levels in mock infected cells. Data represent the mean ± SEM (n = 3). * p < 0.05, ** p < 0.01, *** p < 0.001.

