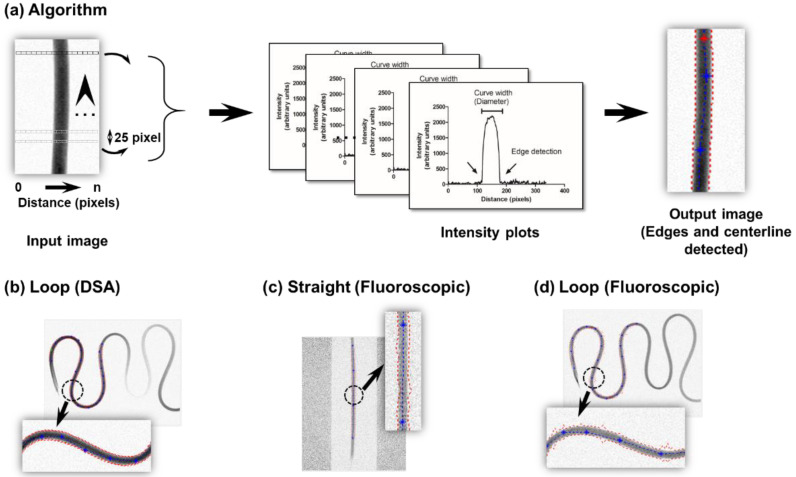
Figure 2.
Edge detection method for area and distance calculation. (a) Algorithm elucidating the process of edge detection for an input image based on multiple distance-intensity plots obtained at discrete intervals (25 pixels) between the ROIs (up arrowhead indicates direction of fluid flow; dye propagation distance and edge detection are evaluated along this direction), (b) extracted edges, and the centerline based on a loop configuration for DSA acquisition. For fluoroscopic imaging, the extracted edges and centerline are based on a (c) straight tube, or (d) loop configuration. Dotted red lines indicate edges, and dotted blue lines indicate centerline (zoomed image in inset).

