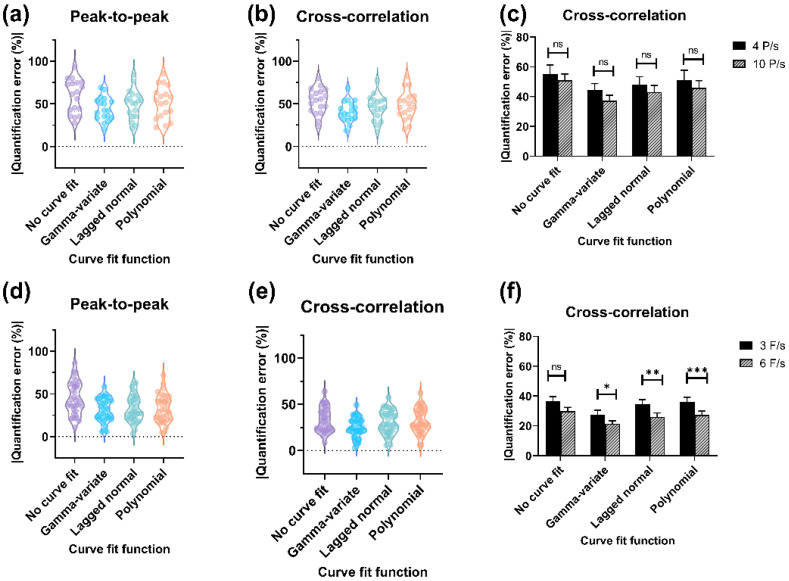
Figure 4.
Evaluation of quantification error, Upper panel: Fluoroscopic imaging, Lower panel: DSA acquisition. Violin plots illustrating overall quantification error with PP and CC, algorithms for (a,b) fluoroscopic imaging, and (d,e) DSA acquisition. Bar graphs showing the absolute quantification error (mean ± SEM) with various curve-fitting models at different sampling rates for (c) fluoroscopic, and (f) DSA acquisition. The shape of the violin plot indicates overall sample distribution, and the central region specifies the median and interquartile range. ns—non-significant, *—0.044, **—0.013, ***—0.022.

