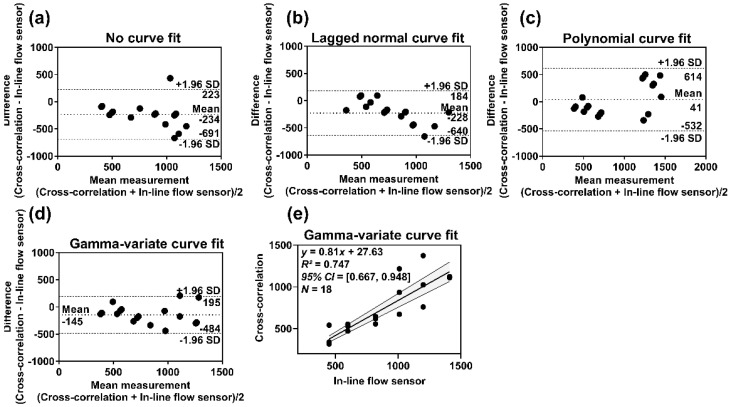
Figure 6.
(a–d) Bland–Altman plots for DSA acquisition showing the bias (mean) and limits of agreement (mean ± 1.96 × SD) for CC algorithm with/without curve fitting versus in-line flow sensor measurement, (e) Scatter plot showing the correlation between measurements of CC algorithm with gamma-variate curve fit versus in-line flow sensor reading, along with 95% confidence bands of the best-fit line. (For fluoroscopic imaging, refer to Figure S3).

