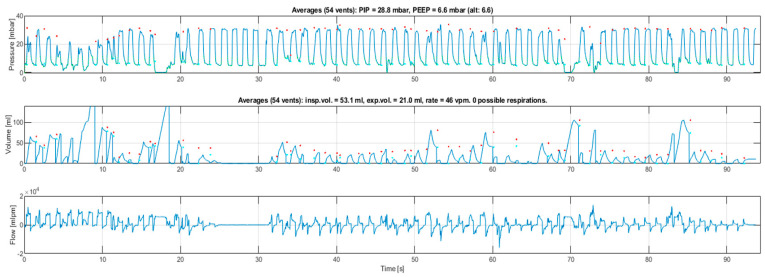
Figure 2.
Graphical respiratory function monitor output from a clinical ventilation sequence. The upper curve shows peak inflating pressure, generally maintained around 30 mbar (1 mbar = 1.02 cmH2O and the units are used interchangeably in this article). The second curve shows tidal volume (mL); the discrepancy between inflated and expired volumes is due to mask leak. The third curve shows gas flow (mL/min), with positive values indicating flow towards the neonate and negative values indicating flow away. The volume and flow curves disappear while pressure is maintained between 25–30 s, indicating obstruction to gas flow which is rapidly corrected.

