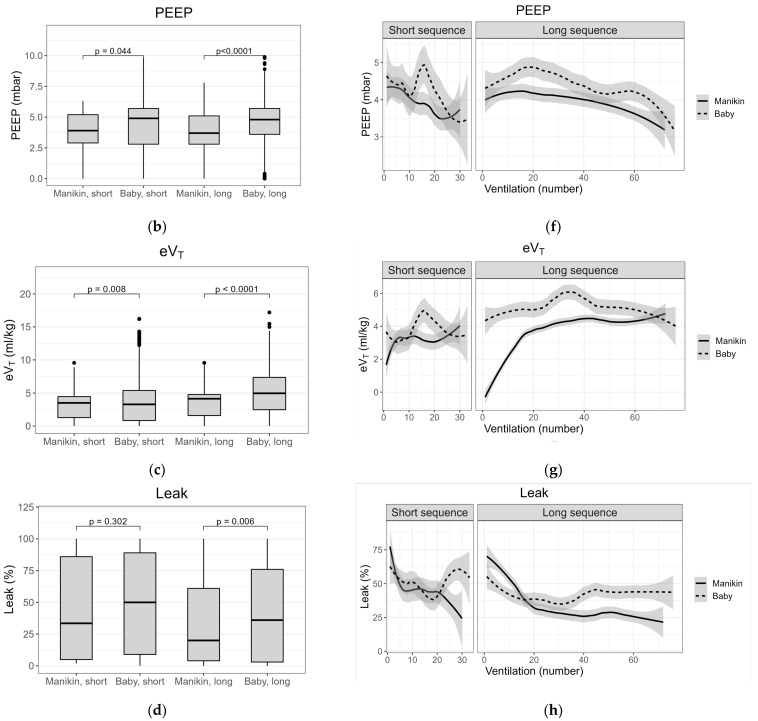
Figure 3.
(a–d) Box plots of median (interquartile range; range) PIP (peak inflating pressure), PEEP (positive end-expiratory pressure, eVT (expiratory tidal volume) and leak for groups Manikin Short (MS), Baby Short (BS), Manikin Long (ML) and Baby Long (BL); (e–h) Dynamical smoothed mean (standard error) plots of PIP, PEEP, eVT and leak for groups MS, BS, ML and BL.


