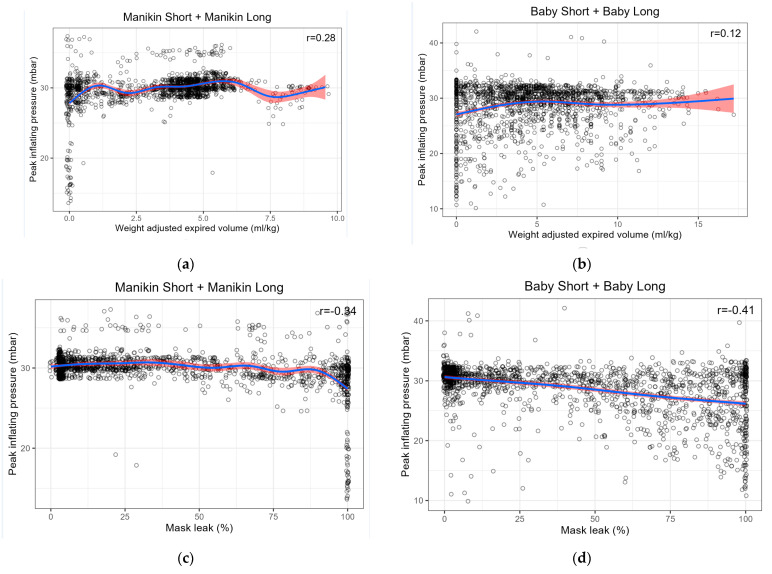
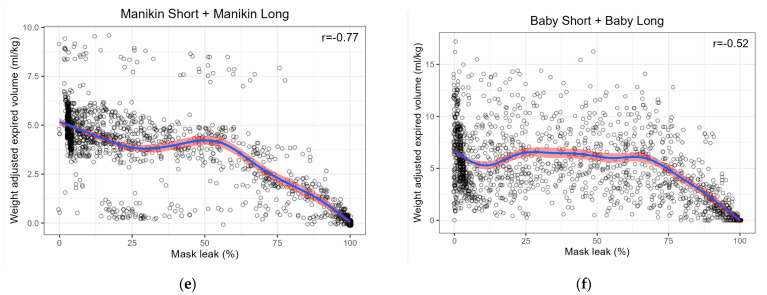
Figure 4.
Scatter plots of correlation between (a) Peak inflating pressure (PIP) and expired tidal volume (eVT) for combined Manikin Short + Manikin Long (MS + ML); (b) PIP and eVT for combined Baby Short + Baby Long (BS + BL); (c) PIP and leak for combined MS + ML; (d) PIP and leak for combined BS + BL; (e) leak and eVT for combined MS + ML; (f) leak and eVT for combined BS + BL. Note that Pearson’s r given in the figures differs from those quoted in Table 2 as a result of the combination of manikin and baby groups.


