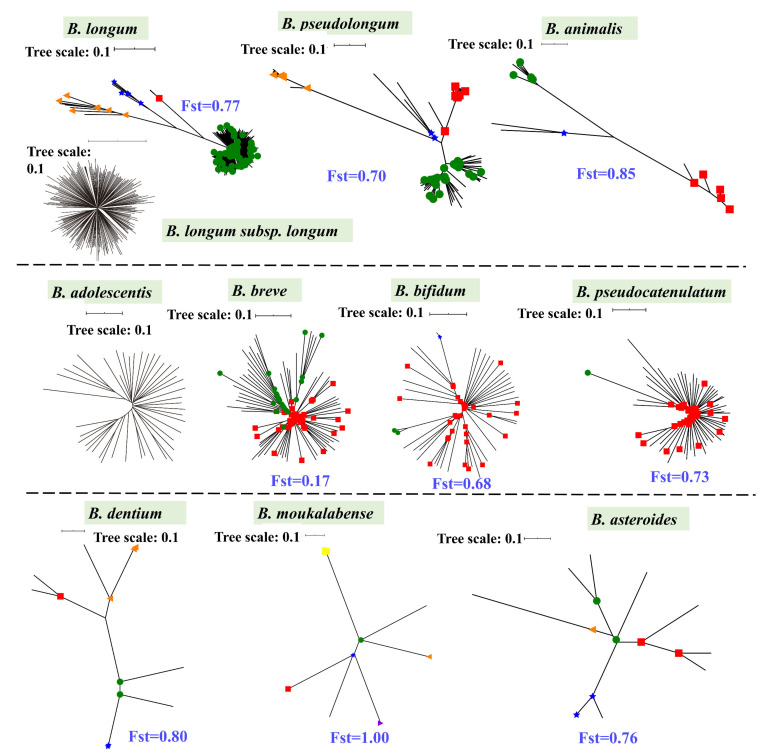
Figure 3.
Phylogenetic structures. Phylogenetic structures of bifidobacterial species. The Bifidobacterium species with more than 10 publicly available genomes in the NCBI database were selected, and a maximum likelihood (ML) tree was constructed based on bi-SNPs in the core genome of each species. The corresponding NJ trees were also constructed (Figure S1B), and similar topologies as those ML trees are shown. Reference genomes of each species used for tree construction are shown in bold in Table S1. For B. longum, population structures of B. longum (upper) and B. longum subsp. longum (lower) are shown. The scale bars for trees were uniformly 0.1. The node symbols represent population clusters based on Bayesian Analysis of Population Structure (BAPS) hierarchical clustering. Within each species, the average Fst values between BAPS populations are also shown.

