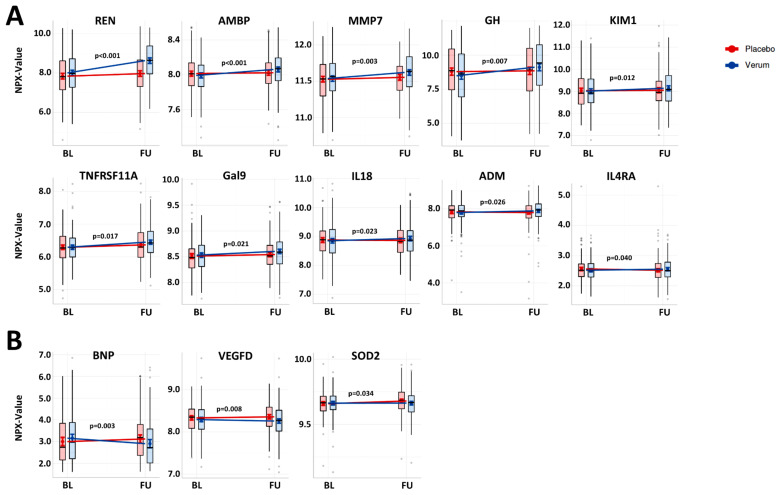
Figure 2.
Effect of spironolactone treatment on differential regulation of plasma biomarkers in HFpEF. (A,B): Plasma biomarkers with significantly increased (A) or decreased (B) expression levels from baseline (BL) to twelve-month follow-up (FU) following spironolactone treatment (verum) vs. placebo control are shown (corrected for age and sex). The modelled effects are illustrated as expected marginal means with 95% CIs. The semi-transparent boxplots show the median (centre line) and the lower and the upper quartile (box) of the originally measured NPX values; the whiskers extend to the minimum/maximum, but are capped at a distance of 1.5 times the interquartile range above the upper/lower quartile. p-values of the interactions from linear mixed effect models are reported in the respective graphs.

