
Fig. 1 |. Methods comparison.
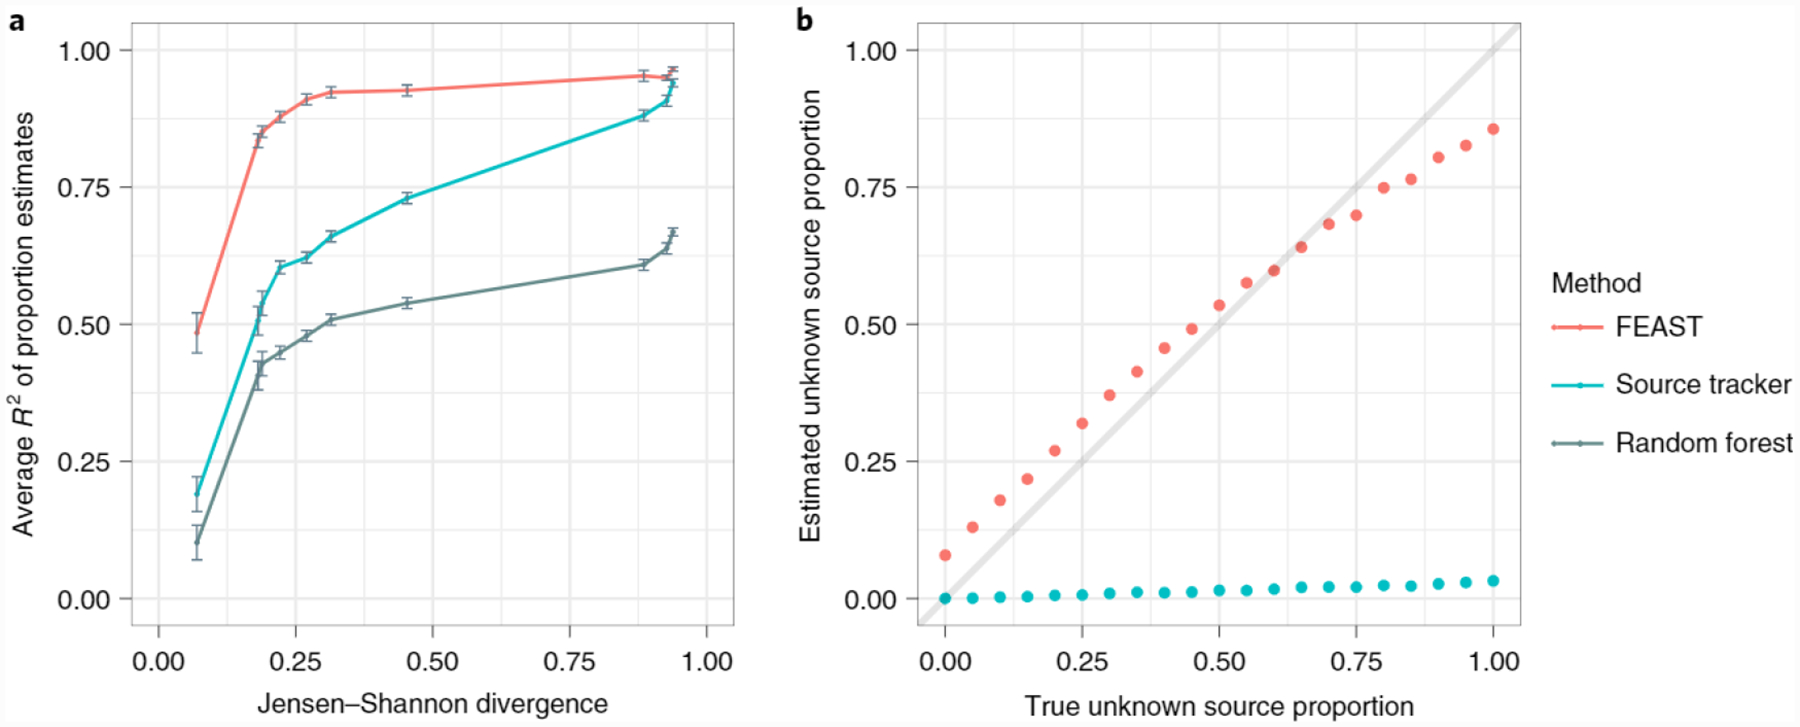
a, The accuracy of FEAST, the random forest classifier and SourceTracker on simulated data. Each simulation was performed using 20 real source environments and simulated sinks. The x axis is average Jensen-Shannon divergence value across known sources (that is, the degree of overlap between the sources from completely identical to completely non-overlapping). The y axis represents correlation across all source environments between true and estimated mixing proportions; error bars show the standard error of the mean (n = 30). b, Evaluation of FEAST and SourceTracker through varying levels of unknown source proportions.